The viewer has three side panels for detailed scene control. Open them from the panel buttons on the left side of the toolbar, or use keyboard shortcuts.
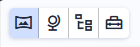
The four buttons are, from left to right: Full Viewer (closes the side panel), Scene Properties, Model Tree, and Interactive Tools. Clicking a panel button opens that panel. Click Full Viewer to close the side panel and return the full window to the 3D view.
Show, hide, and edit individual objects in the scene. Open with Alt+M.
Subsections of Accessing Model Details
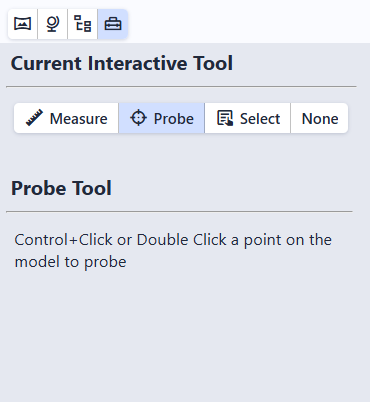
The Tools panel controls what happens when you double-click (or Ctrl+Click) on an object in the scene. Open it by clicking the Tools button in the toolbar or pressing Alt+T.
Select the clicked object in the Model Tree for editing
None
Disable double-click and Ctrl+Click interaction
Tip
Ctrl+Click works the same as double-click for all tools. This is helpful on laptop trackpads where double-clicking precisely can be difficult.
Subsections of Interactive Tools
Probe is the default tool. Double-click (or Ctrl+Click) on any object to see detailed information about it at that location. A fuchsia-colored wireframe sphere marks the probed point.
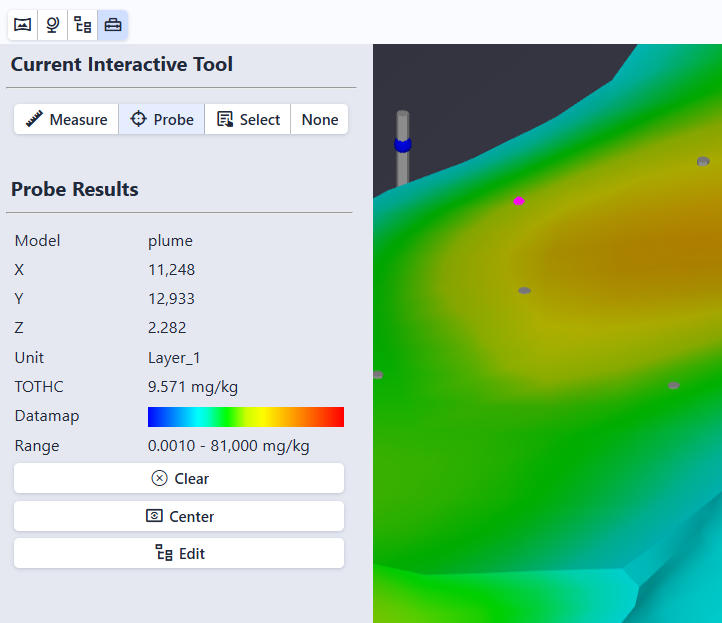
Probe Results
The Probe Results section in the Tools panel shows:
Field
Description
Coordinate
The X, Y, Z location of the probed point
Unit
The name of the object that was probed
Analyte
The chemical or substance being measured (if the object contains analytical data)
Value
The interpolated data value at that location. This is an approximation based on the 3D model, not the exact value from the original data.
Data Range
The minimum and maximum values for this dataset
Datamap
A visual color bar showing how values map to colors
Info
The fields shown depend on the type of object probed. Objects without analytical data show only the coordinate and unit name.
Action Buttons
Three buttons appear below the probe results:
Clear — Remove the probe marker and results
Center — Move the camera to orbit around the probed point. After clicking Center, all mouse rotations pivot around this point instead of the center of the scene.
Edit — Open the Model Tree with the probed object selected for editing
The Measure tool calculates distance, slope, and direction between two points. Double-click (or Ctrl+Click) on the first point, then double-click (or Ctrl+Click) on the second point to see the results.
Measurements
Measurement
Description
3D Distance
Straight-line distance between the two points
2D Distance
Horizontal distance only (ignoring elevation)
Vertical Distance (ΔZ)
Difference in elevation between the two points
Slope
Angle of the line between the points (0° = horizontal, 90° = vertical)
Aspect (degrees)
Compass bearing from point 1 to point 2 (0° = North, 90° = East, 180° = South, 270° = West)
Aspect (direction)
Compass direction as a label (N, NE, E, SE, S, SW, W, NW)
Info
The measure tool accounts for Z scale (vertical exaggeration) correctly. Slope and distance values reflect true-scale geometry, so the reported numbers are accurate even if the visual appearance looks steeper due to vertical exaggeration.
Click Clear to remove the measurement and start a new one.
The Select tool opens the Model Tree and automatically selects the clicked object, making it easy to immediately edit properties such as opacity, wireframe, or visibility.
Double-click (or Ctrl+Click) on any object in the scene to select it. The Model Tree panel opens with that object highlighted and its properties loaded in the Editor.
The Scene Properties panel controls the camera angle, zoom level, and vertical exaggeration for the entire scene. Open it by clicking the Scene Properties button (second from the left in the toolbar) or pressing Alt+S.
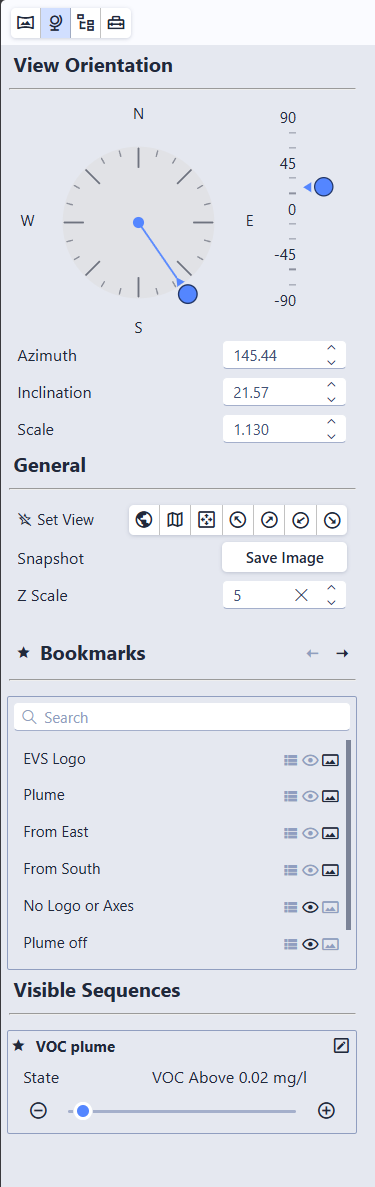
View Orientation
The View Orientation section lets you precisely control the camera angle using interactive controls or numeric inputs.
Compass (Azimuth)
The compass dial controls the horizontal viewing direction. The needle points in the direction the camera is looking.
Click anywhere on the compass to snap to the nearest 15-degree increment
Drag the needle to rotate freely in real time
Cardinal directions (N, E, S, W) are labeled, with major ticks every 45 degrees and minor ticks every 15 degrees
Inclination Slider
The vertical slider to the right of the compass controls the camera’s vertical tilt. Values range from 90 (straight down) to -90 (straight up), with 0 being horizontal.
Click on the scale to snap to the nearest labeled value
Drag the thumb to adjust freely in real time
Major ticks at 90, 45, 0, -45, and -90 degrees
Numeric Inputs
Below the compass and slider, three fields allow precise entry:
Field
Range
Description
Azimuth
0 – 360
Horizontal viewing direction in degrees
Inclination
-90 – 90
Vertical tilt (90 = top-down, 0 = horizontal)
Scale
0.0001+
Zoom level of the view
Each field has spin buttons for fine adjustments.
Set Views
Preset camera positions for quickly jumping to a standard viewing angle:
Scene’s Original View — The default view saved by the scene author
Plan View — Top-down, looking straight down
Fit to Screen — Keep the current angle but zoom to fit the entire model
View from SE / SW / NE / NW — View from four compass directions at a 20-degree inclination
Click the star icon next to Set Views to add them to the toolbar for quick access.
Tip
You can also use keyboard shortcuts: O for the original view, P for plan view, F to fit to screen. See Keyboard Shortcuts for the full list, including numpad shortcuts for all eight compass directions.
Snapshot
Click Snapshot to save a PNG image of the current view. The file is named {scene name}_snapshot.png.
Title
When multiple scenes are open, a Title field appears showing the name of the active viewport. The title defaults to the scene filename but can be edited to any label you prefer. Titles are displayed in the viewport overlay (when enabled) and are preserved when exporting as .ctmws. See Working with Multiple Scenes for details.
Z Scale (Vertical Exaggeration)
The Z Scale slider adjusts vertical exaggeration for the entire scene. A value of 1.0 means true proportions. Higher values stretch the model vertically, making thin layers or subtle elevation changes easier to see.
The initial Z Scale comes from the setting used when the scene was exported from EVS.
Warning
Objects that normally maintain their shape — such as text labels and spheres used as glyphs — will appear distorted if the Z Scale differs from the value used when the scene was saved.
Bookmarks and Sequences
If the scene file includes bookmarks or visible sequences, their controls also appear in this panel. Favorite them here by clicking the star icon to add them to the toolbar for quick access. See Bookmarks and Sequences for details.
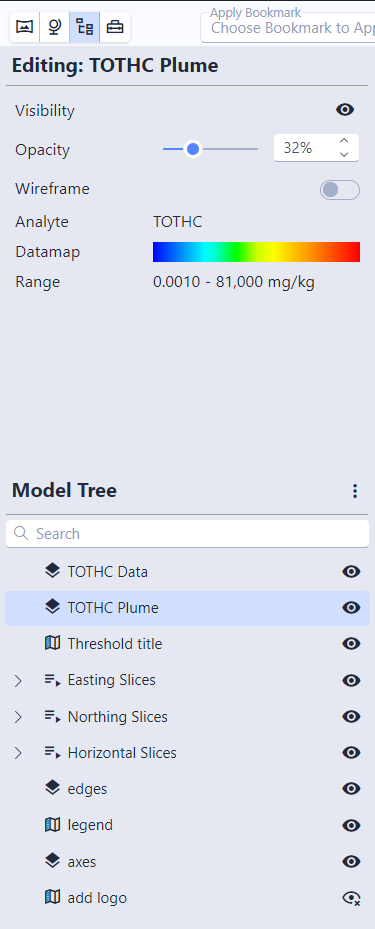
The Model Tree panel shows every object in the scene and lets you control them individually. Open it by clicking the Model Tree button in the toolbar or pressing Alt+M.
The panel has two sections: the Editor at the top and the Model Tree at the bottom.
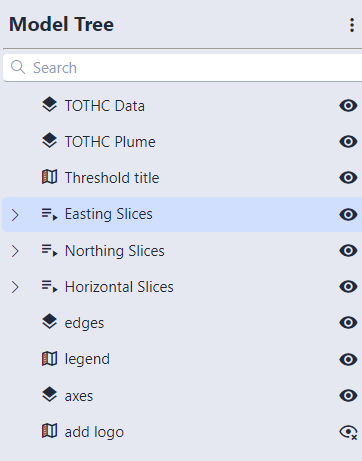
The Model Tree
The lower section lists all objects in the scene, organized in a hierarchy:
Visibility controls — The eye icons on the right show or hide individual objects. Clicking the eye on a group or sequence toggles visibility for everything inside it.
Info
Some objects show a lock icon instead of an eye. Locked objects have their visibility fixed by the scene author and cannot be toggled.
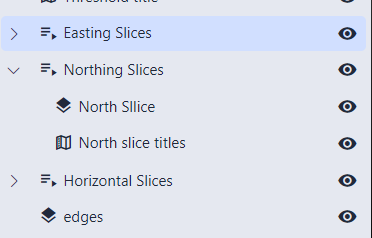
Expanding groups — Groups and sequences can be expanded to reveal their contents. Click any object to select it and edit its properties in the Editor above.
Bulk actions — The three-dot menu at the top right lets you show all, hide all, expand all, or collapse all objects.
Editing Object Properties
Select an object in the tree to open its properties in the Editor panel. The available controls depend on the object type.
Common Controls
Control
Description
Visibility
Show or hide the object
Opacity
Transparency from 0% (invisible) to 100% (solid)
Wireframe
Toggle wireframe rendering
Point / Line Width
Display size of point or line objects
Data Controls
These appear when the selected object contains analytical data (such as contamination values):
Control
Description
Analyte
The chemical or substance being displayed
Datamap
The color scale mapping data values to colors
Data Range
Minimum and maximum values represented by the datamap
Sequence Controls
When a sequence is selected, the editor shows its current state and lets you step through states or change them directly:
You can also favorite a sequence from here by clicking its star icon to add it to the toolbar.
Object Types
Type
Description
Modules
3D geometry such as surfaces, volumes, boreholes, and other model objects
Groups
Folders that organize related objects together
Sequences
Multi-state objects that change content in the scene (see Sequences)