
Introduction
In this tutorial, you will learn how to use the Properties window in Earth Volumetric Studio to view and edit parameters of various objects. This guide covers key features and tools to help you manage your application settings effectively.
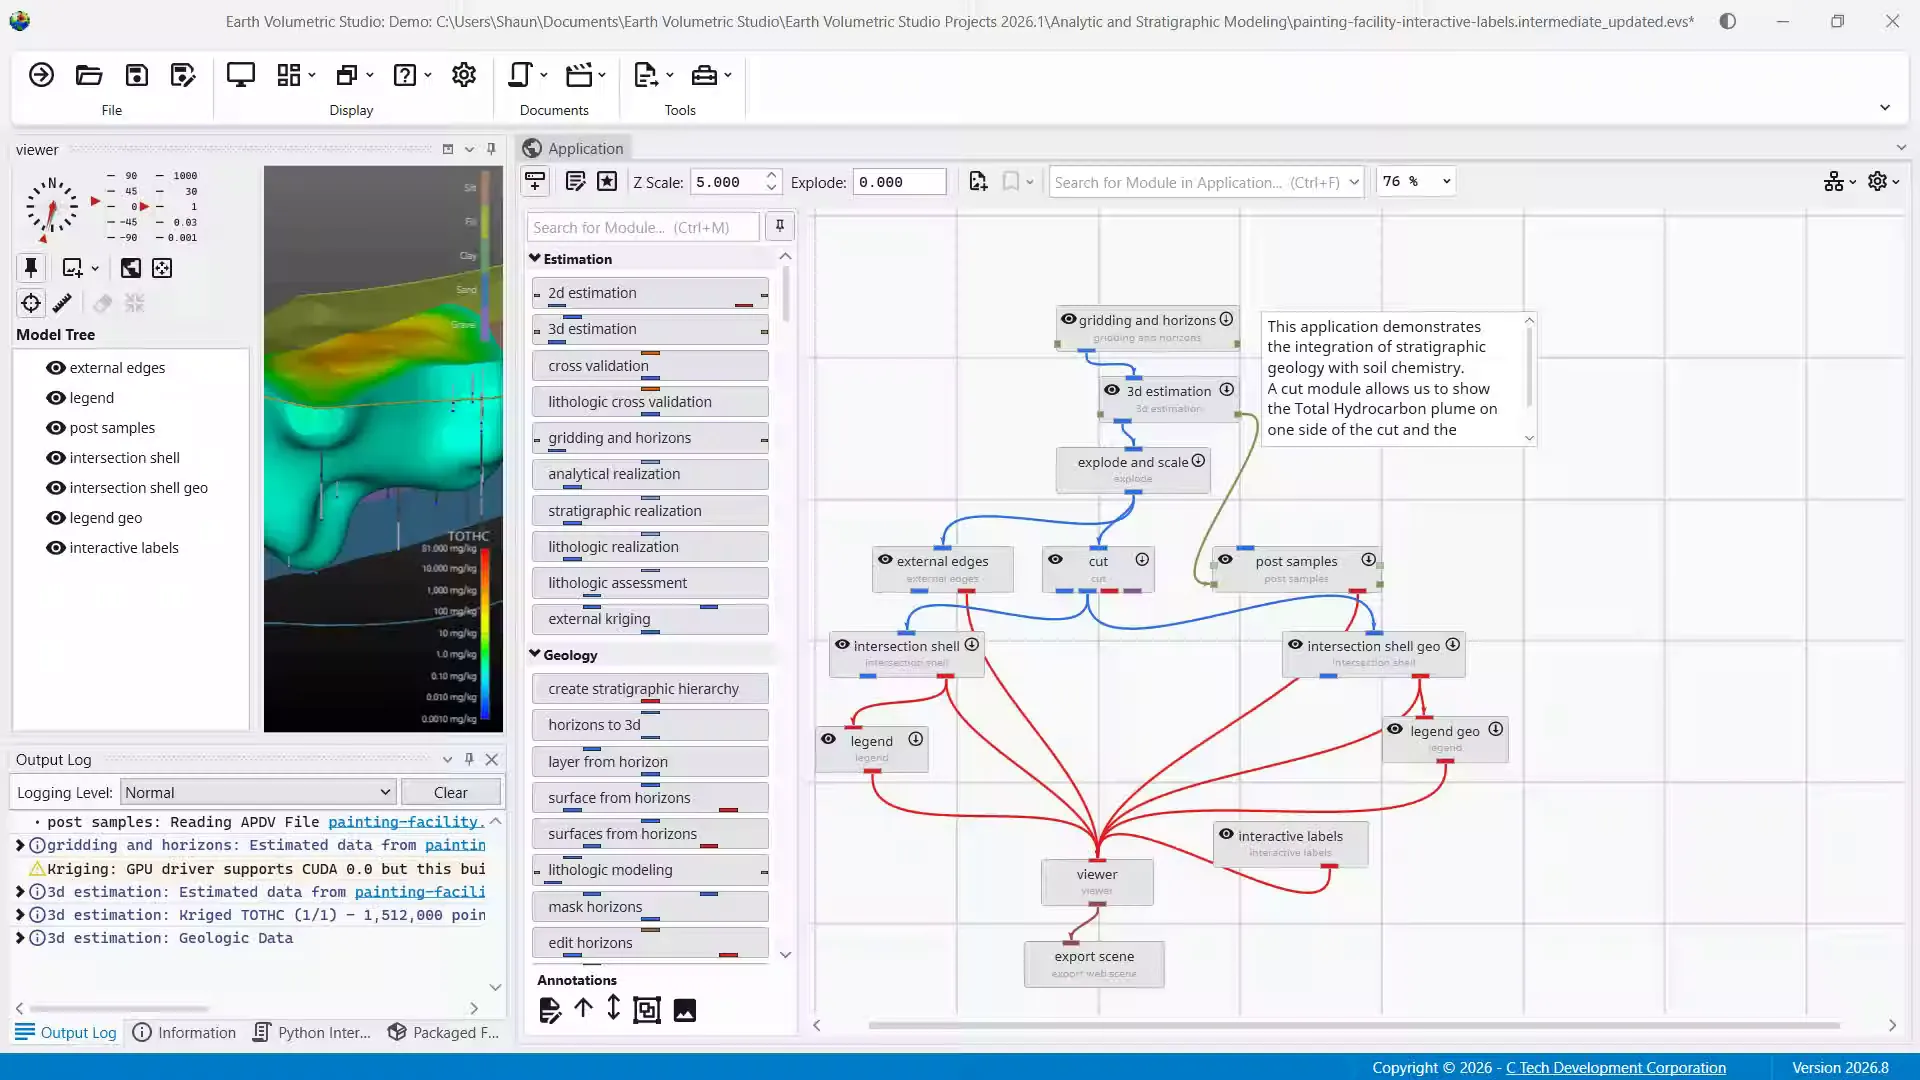
In this demonstration, we will be looking at the Properties window as a primary interface to control objects in your application.
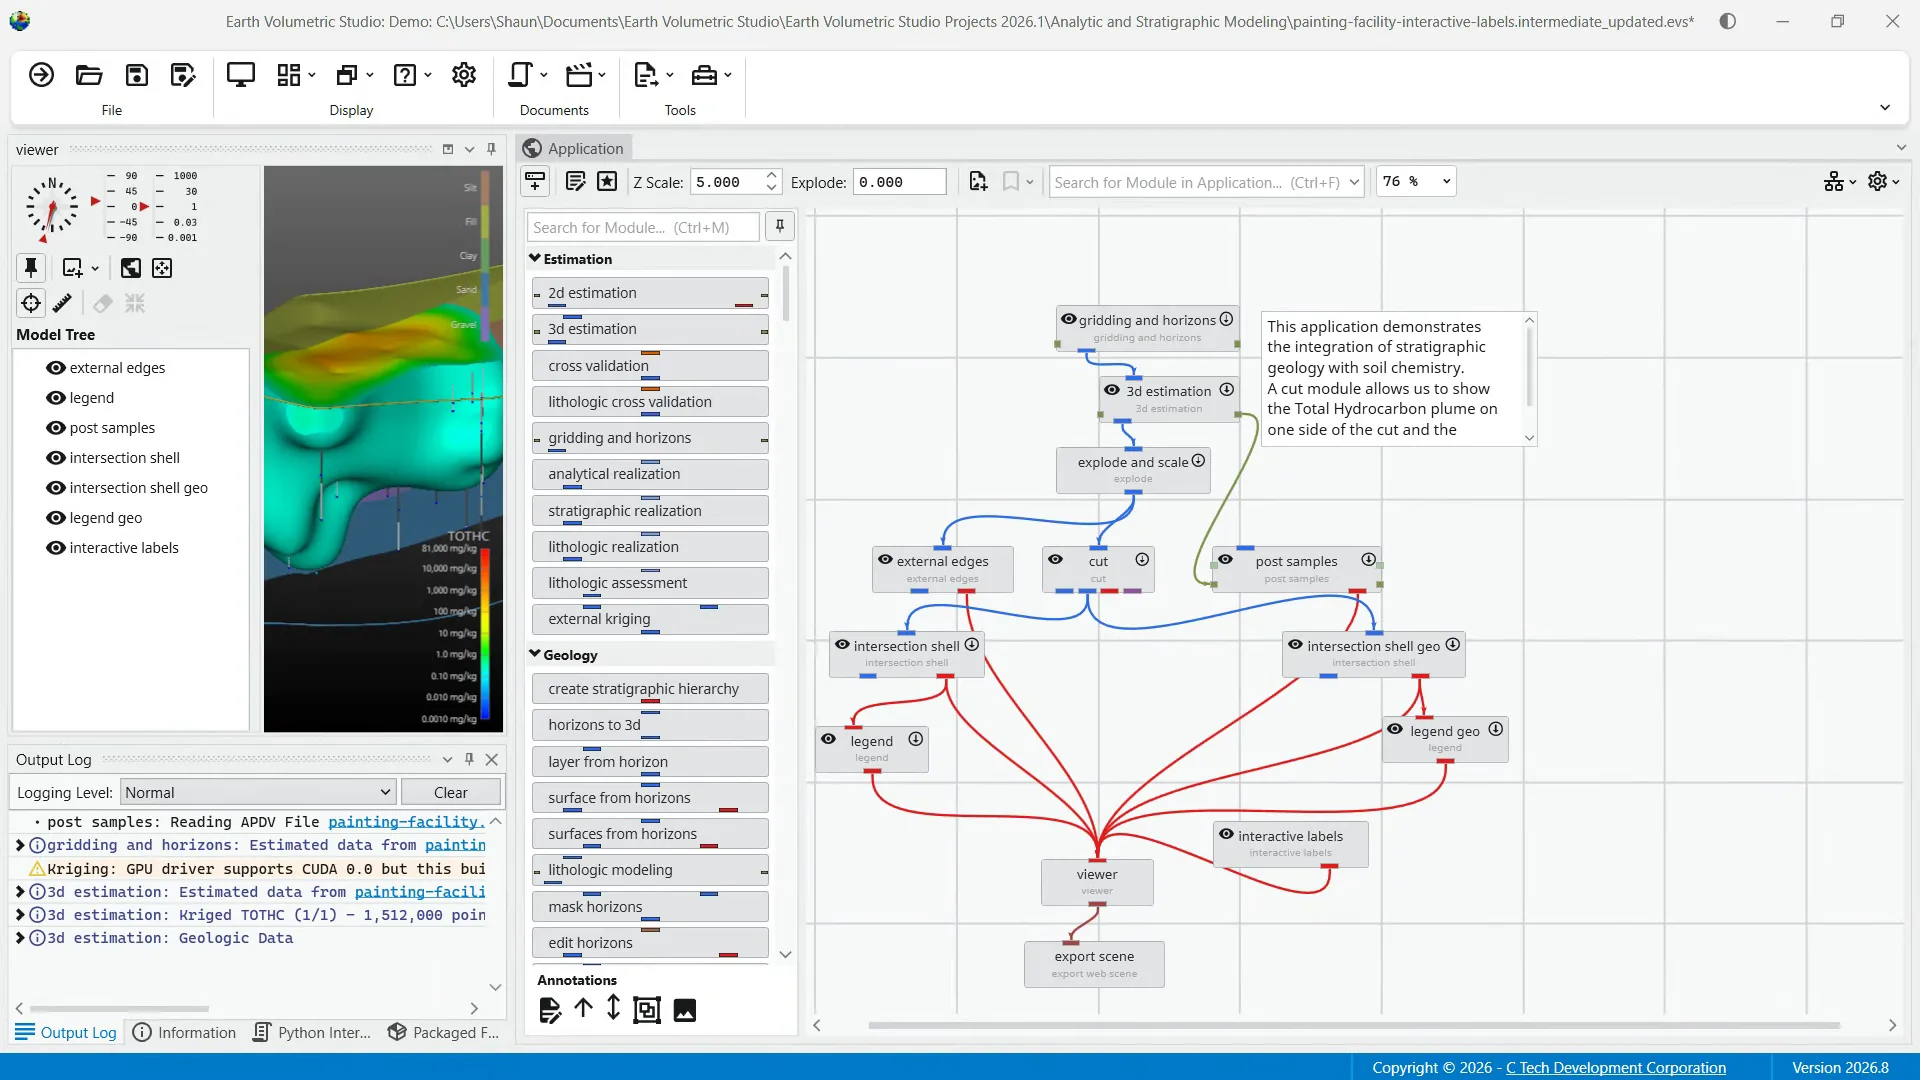
This includes editing options for modules, ports, or the application itself. If not already open, the way to access the properties window is from the Windows button on the main toolbar.
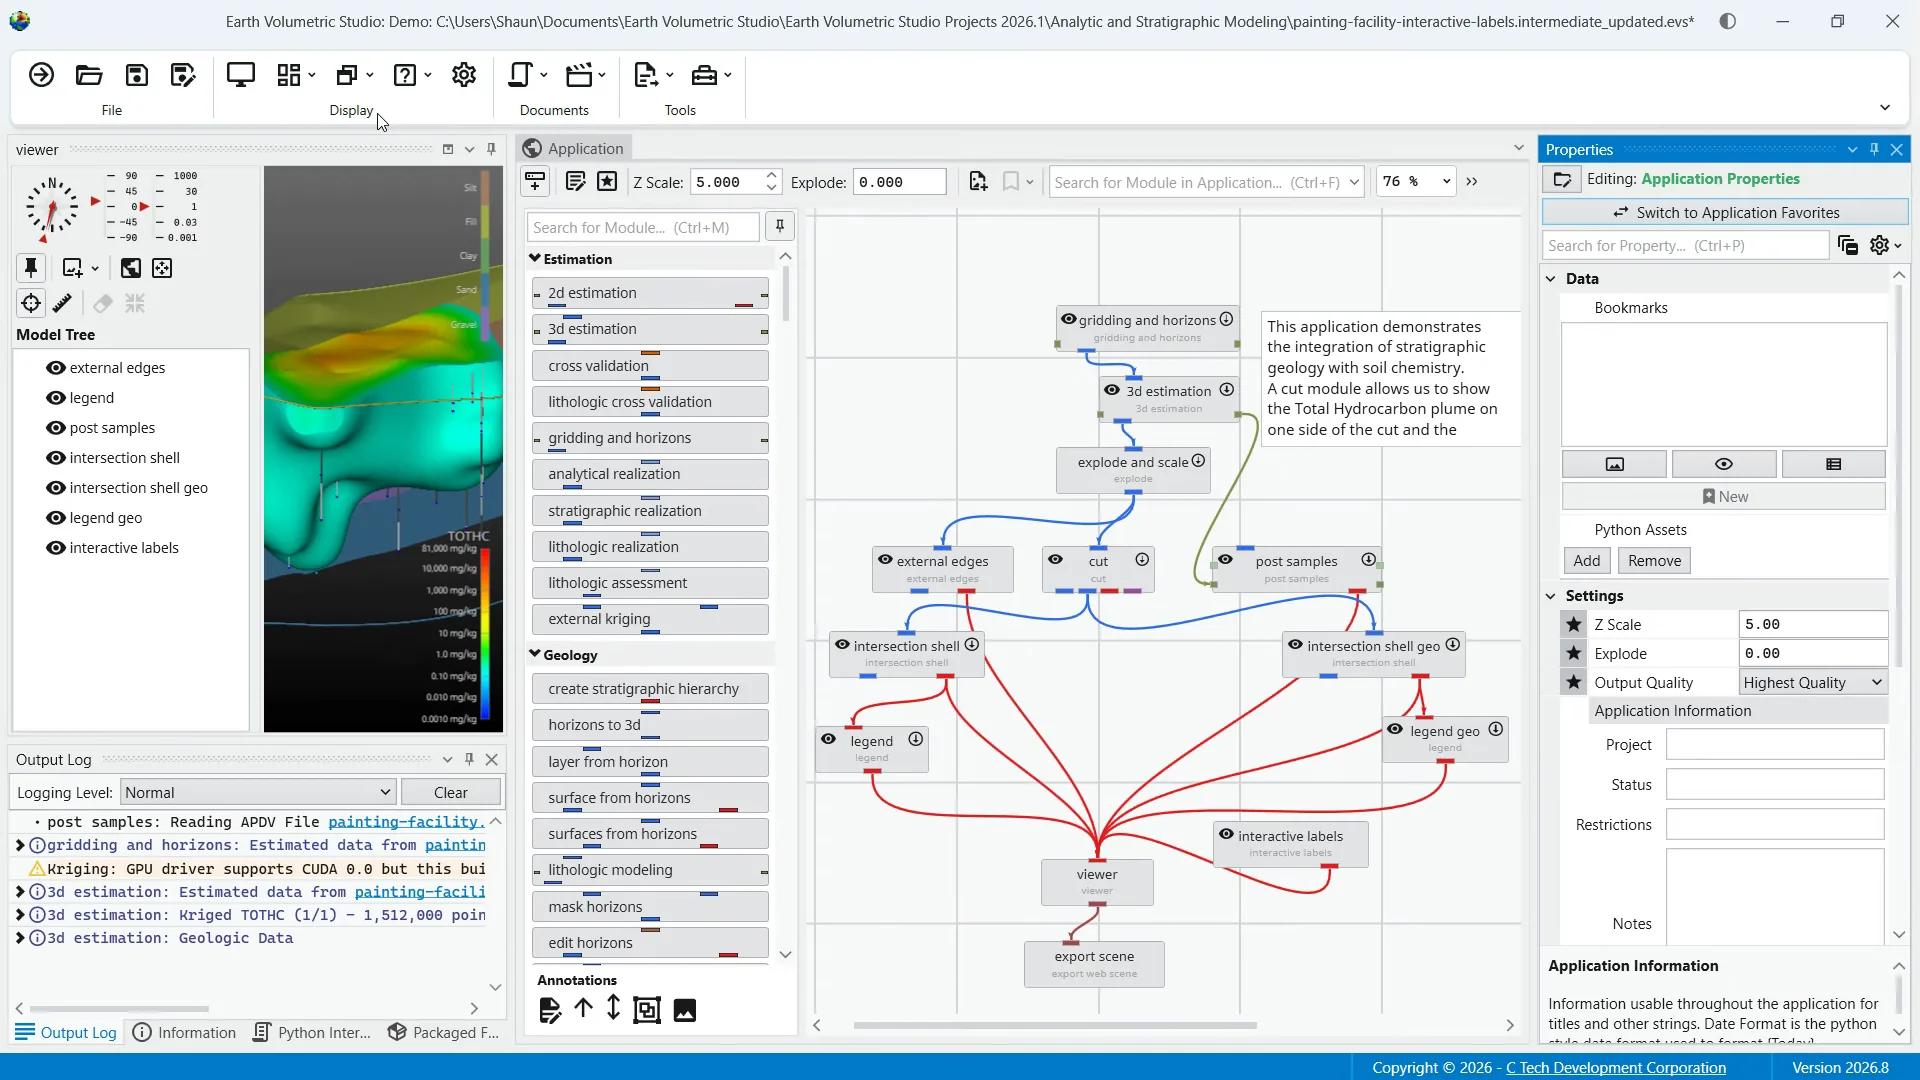
When you have the window visible, you can load objects properties for editing. The most direct way to do this is to double click on the module or port you would like to see the properties window for.
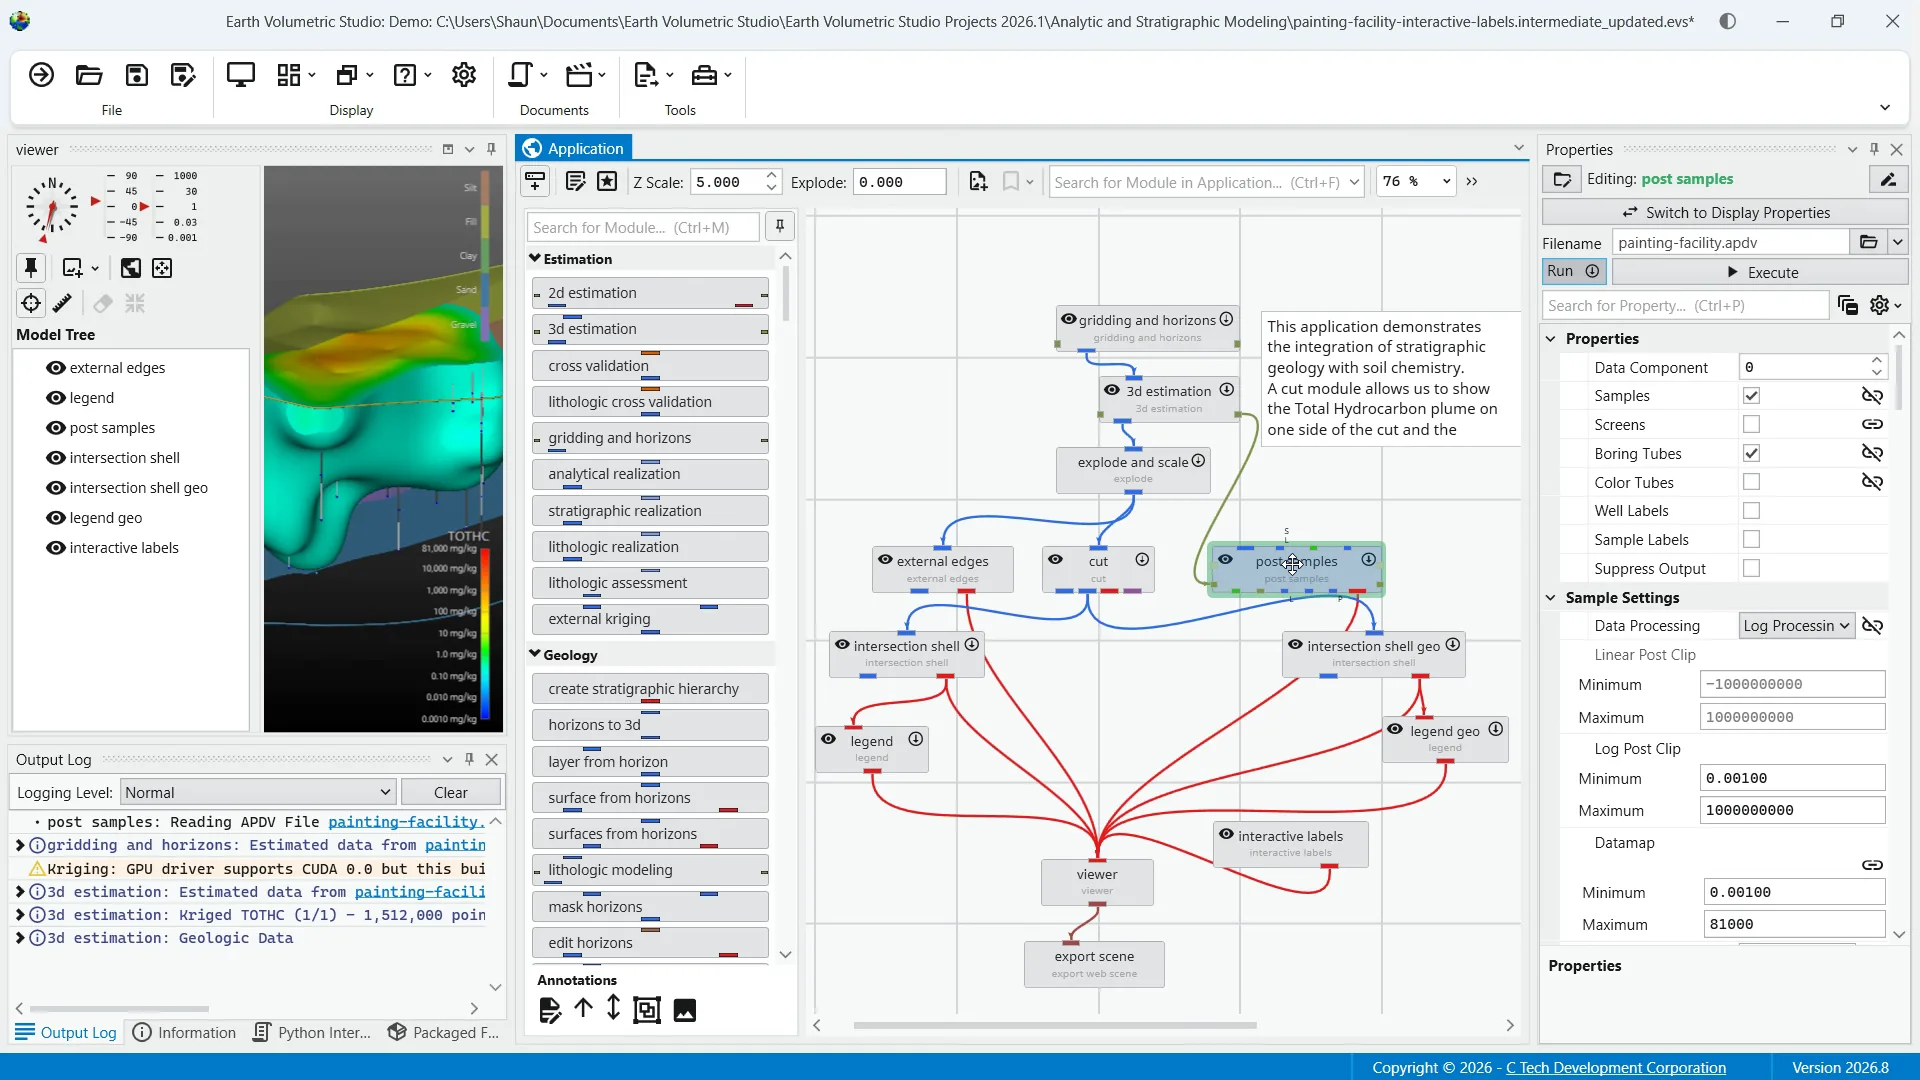
The properties window has several useful tools to help manage your parameters, such as the "search for property" box to filter displayed properties by searching a text string. You can also collapse and expand categories by clicking on the collapse button.
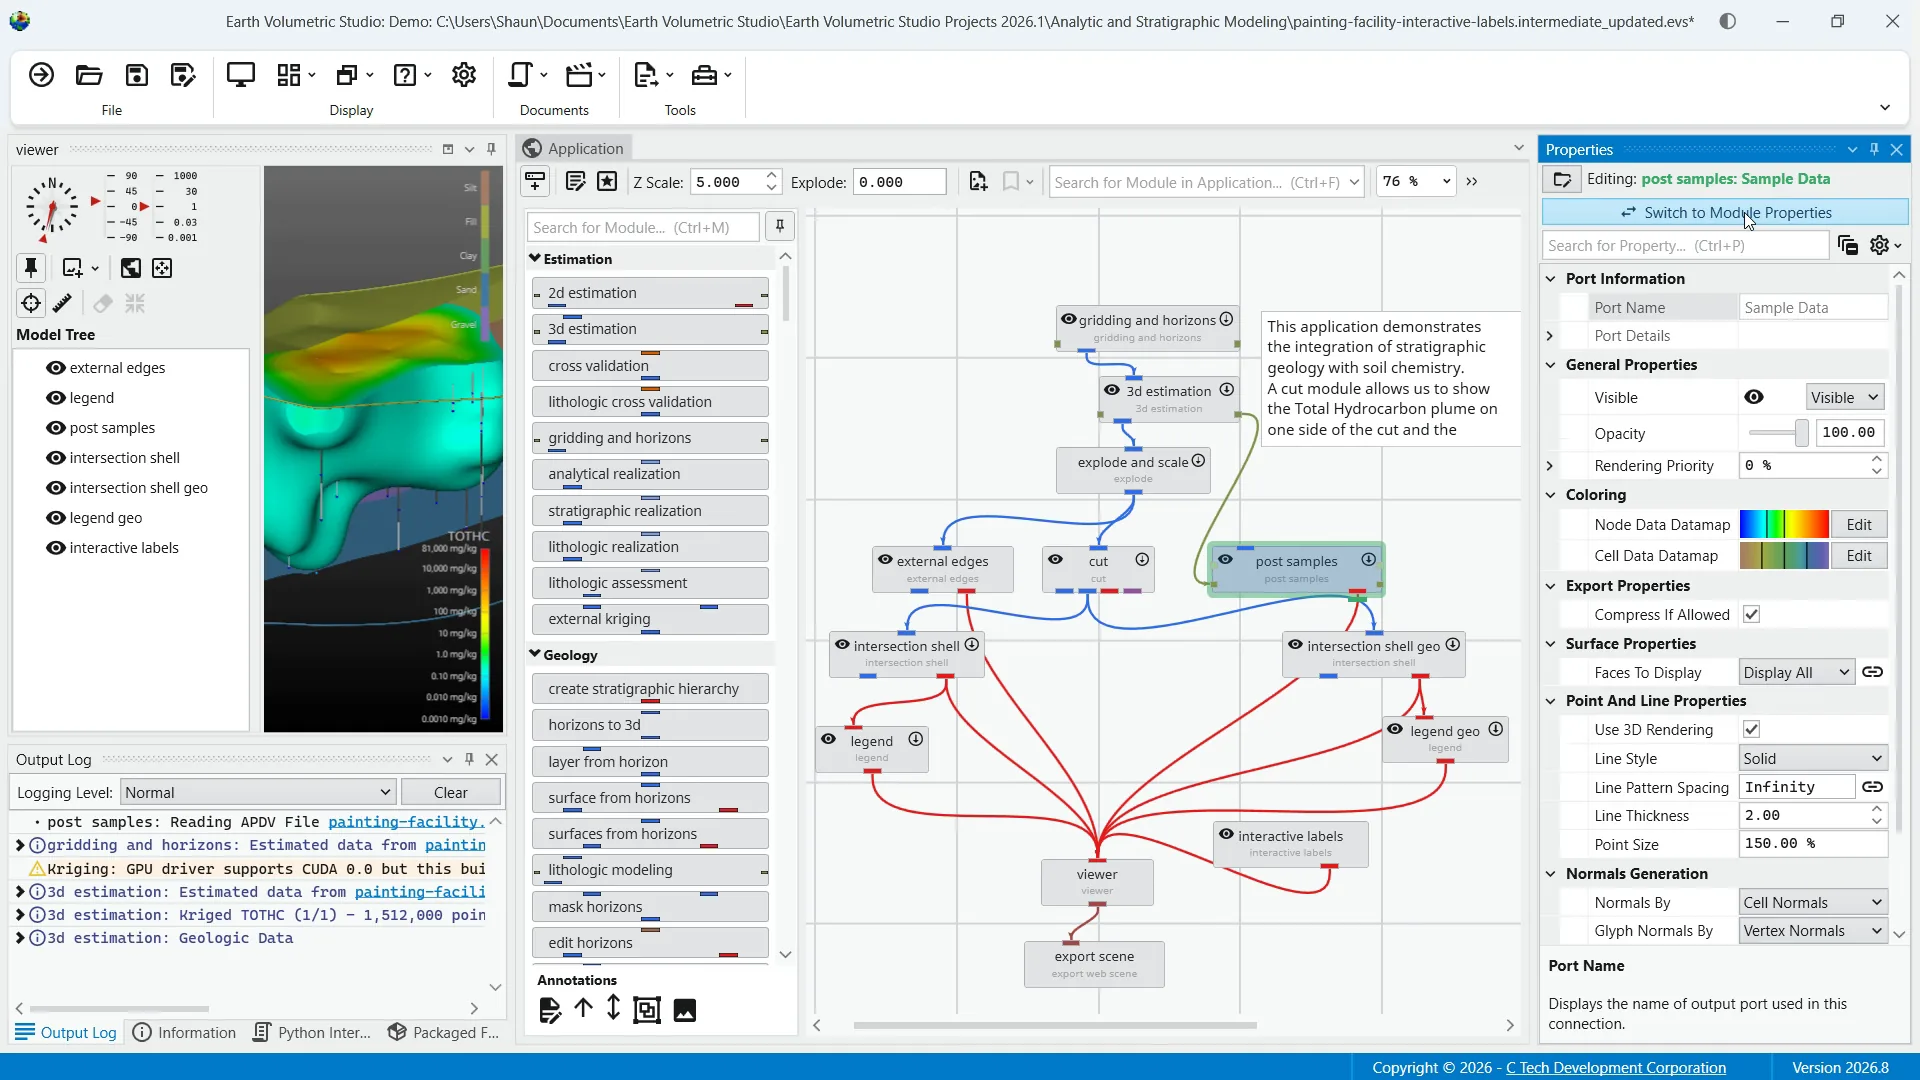
Next to that is your options menu where you can control global settings for the window if you'd like to change how properties are displayed. The switch to display properties button can toggle between the properties of the selected module and that of the output ports of that module.
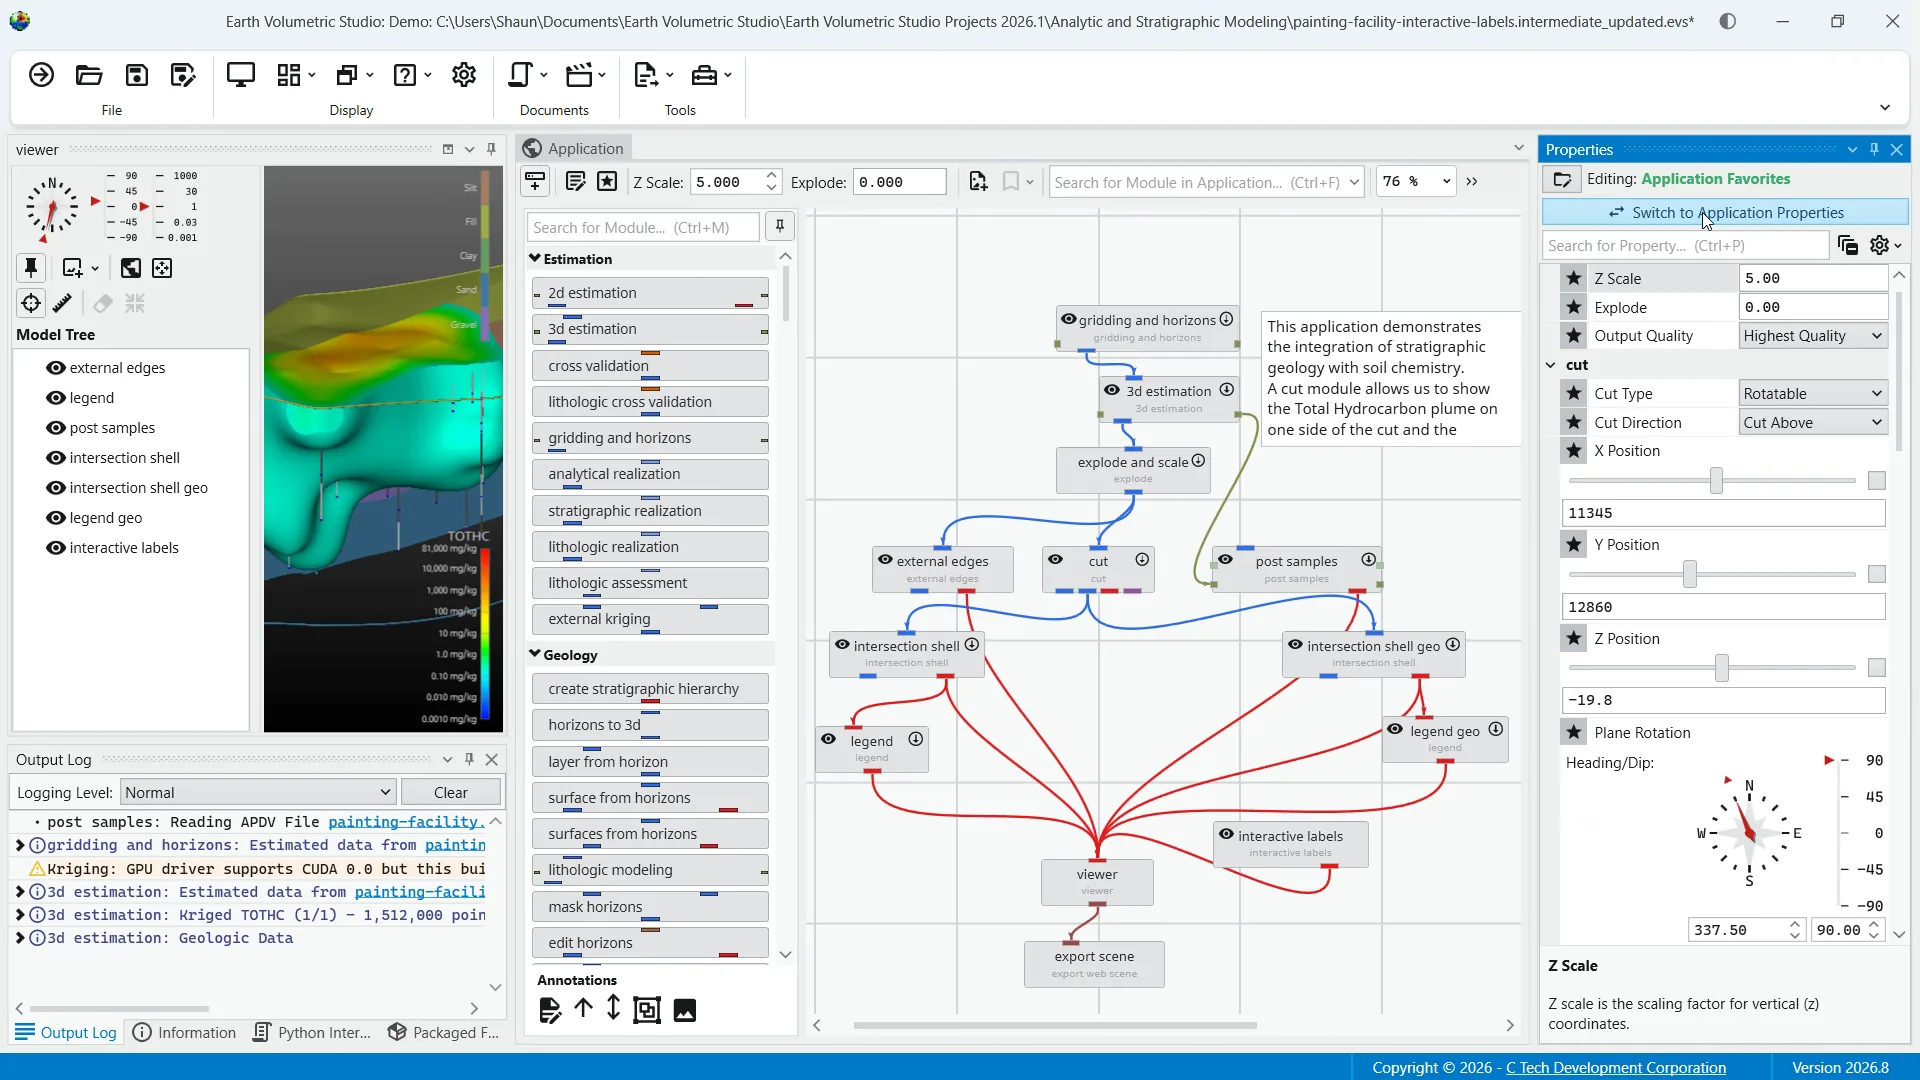
This can be a quicker way of managing port and module properties without moving your cursor over to select and double-click each time in the application network. Additionally, the same button switches to application favorites when you are in the application properties window.
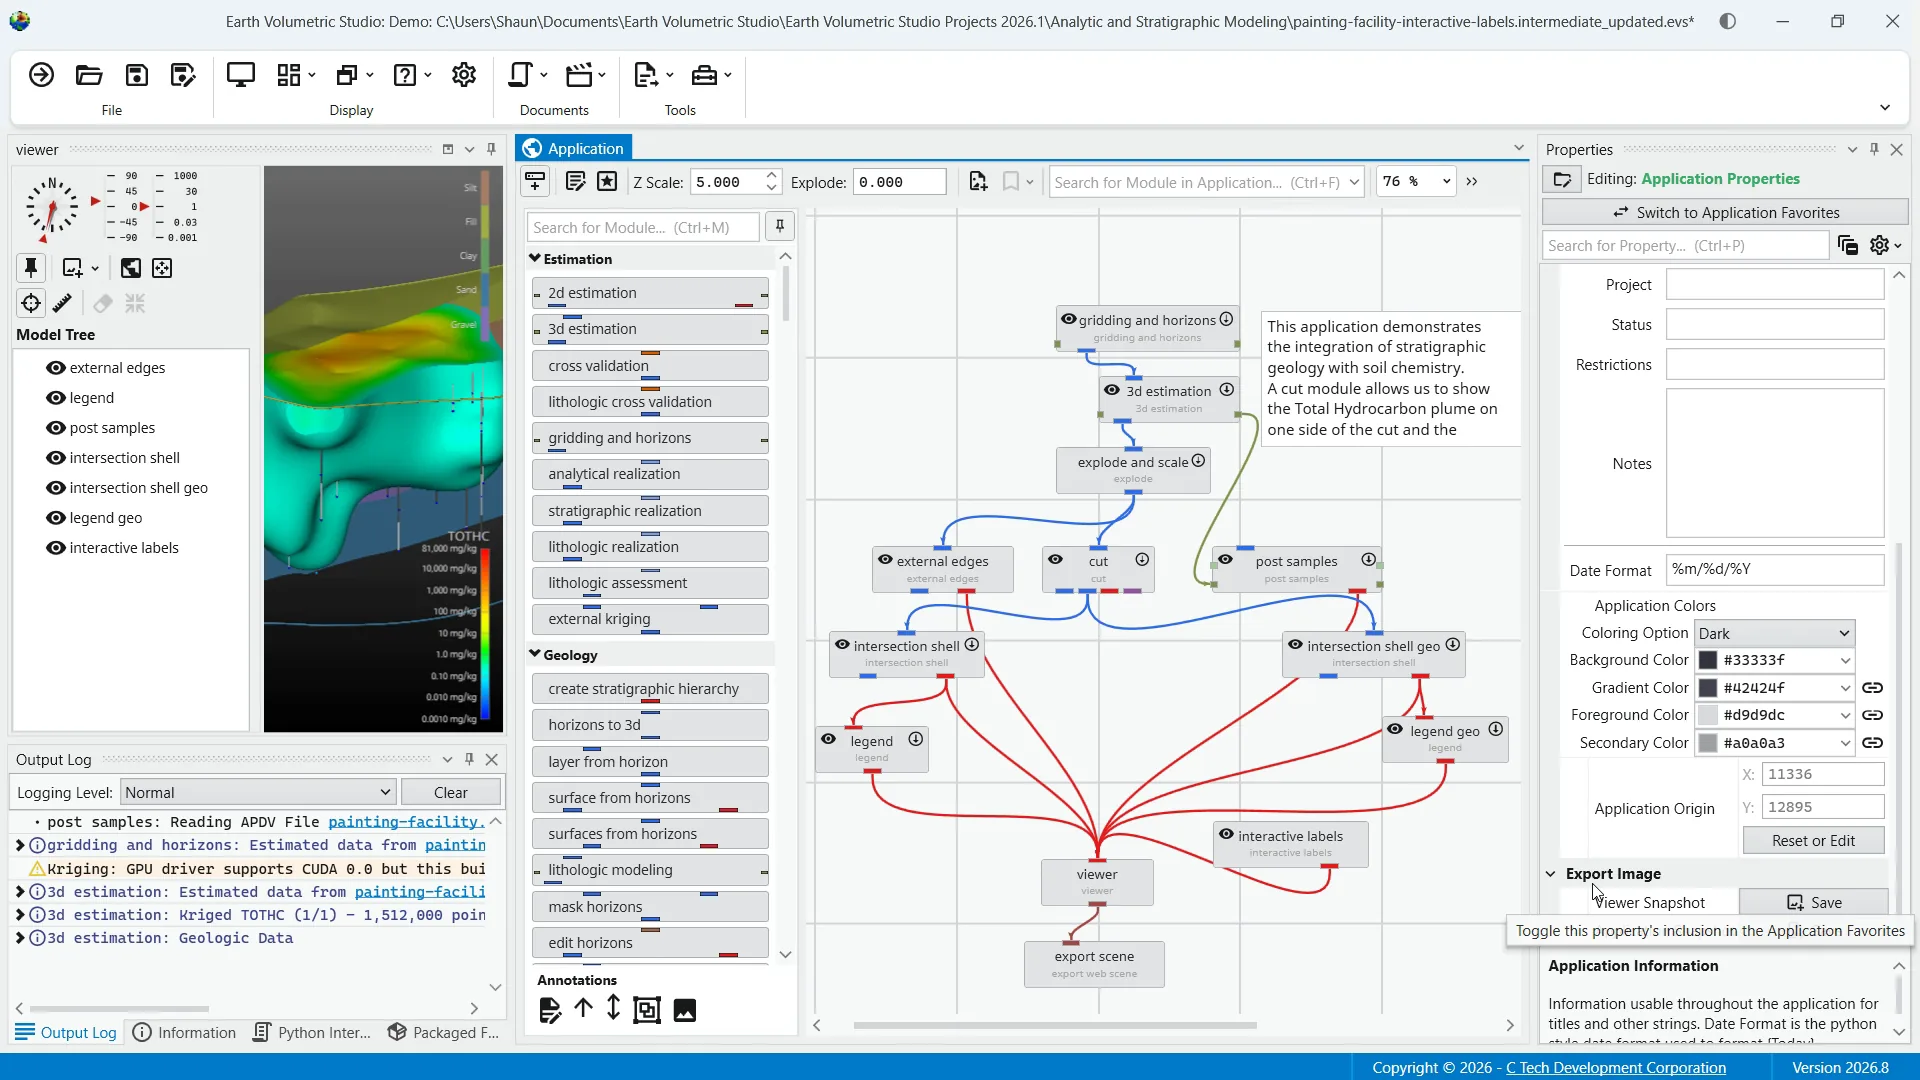
Note, you can favorite any property in an application. To favorite a property, click in the empty space to the left of its name. A star icon will appear indicating that the property has been added to your application favorites.
Lastly, you'll notice at the bottom of the properties window a description area. This displays a brief explanation of the property you have selected. This can be helpful context when you are making your configurations.
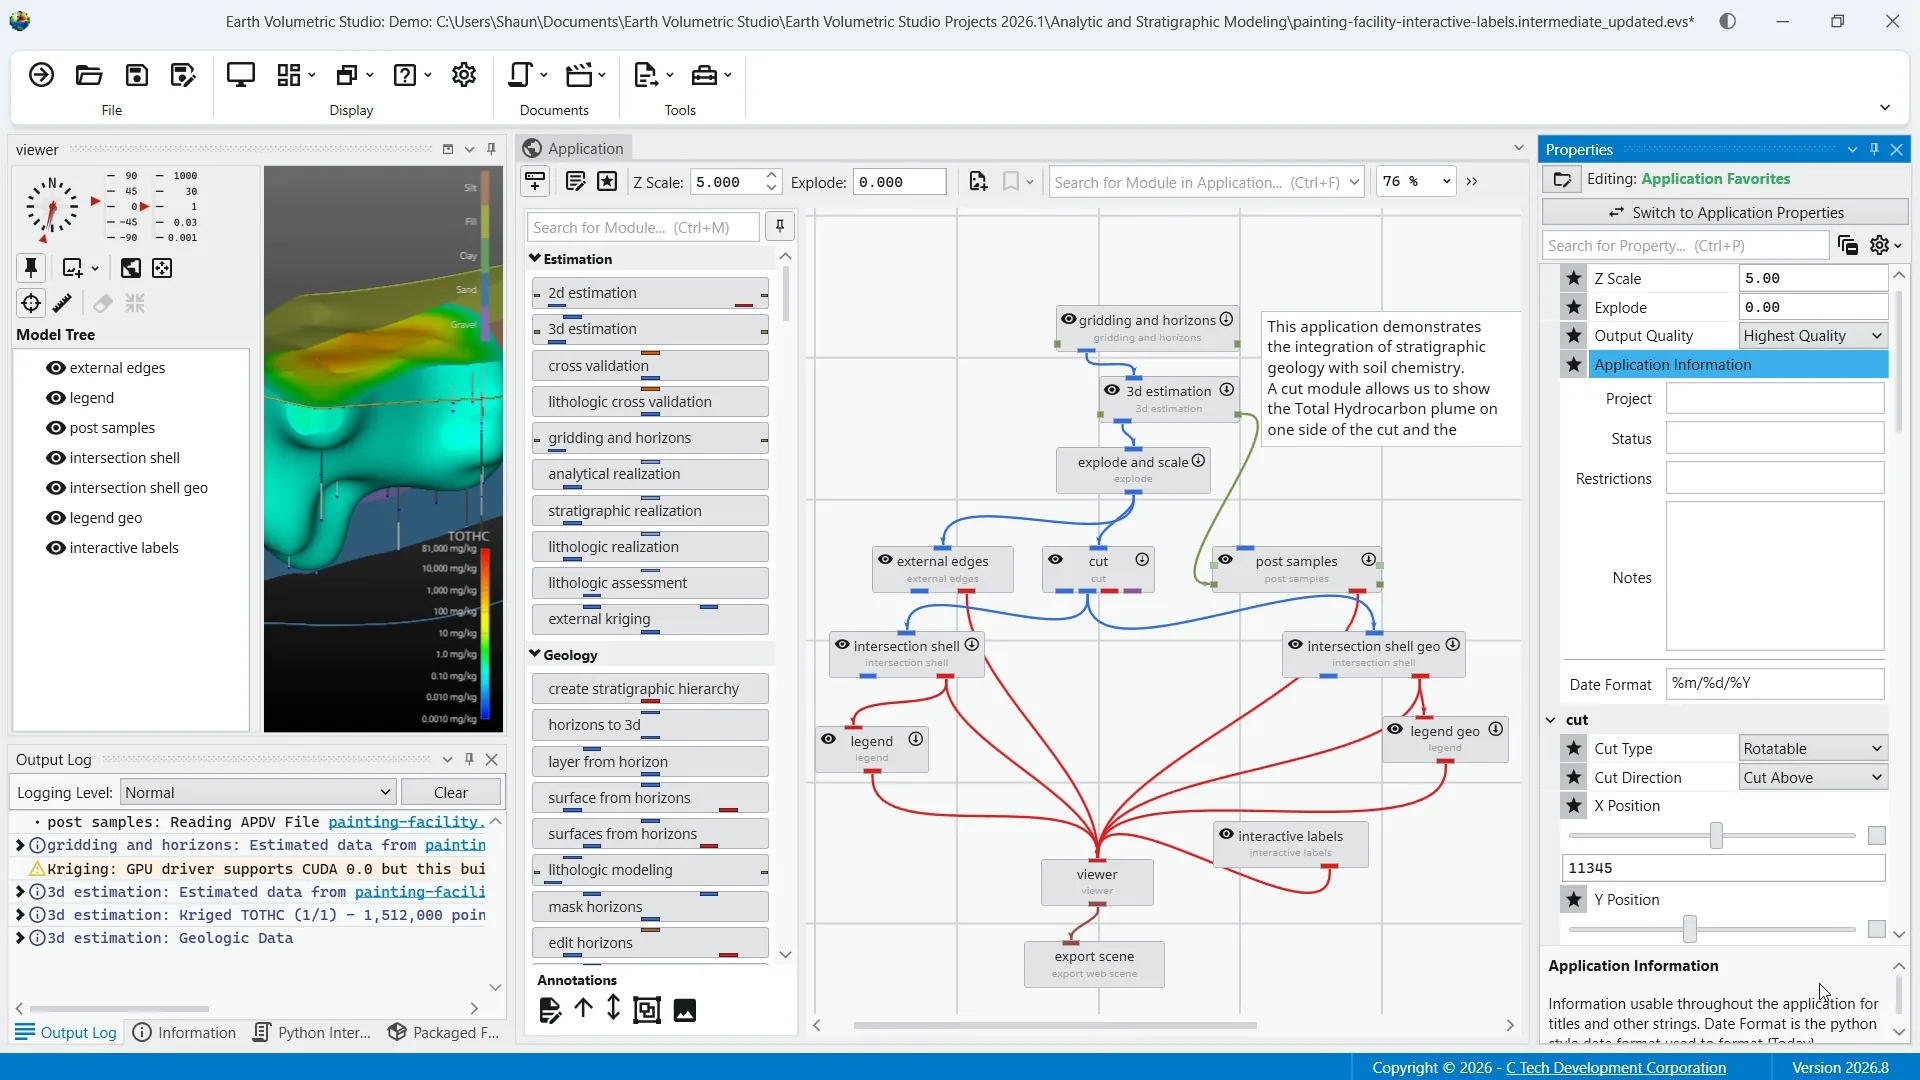
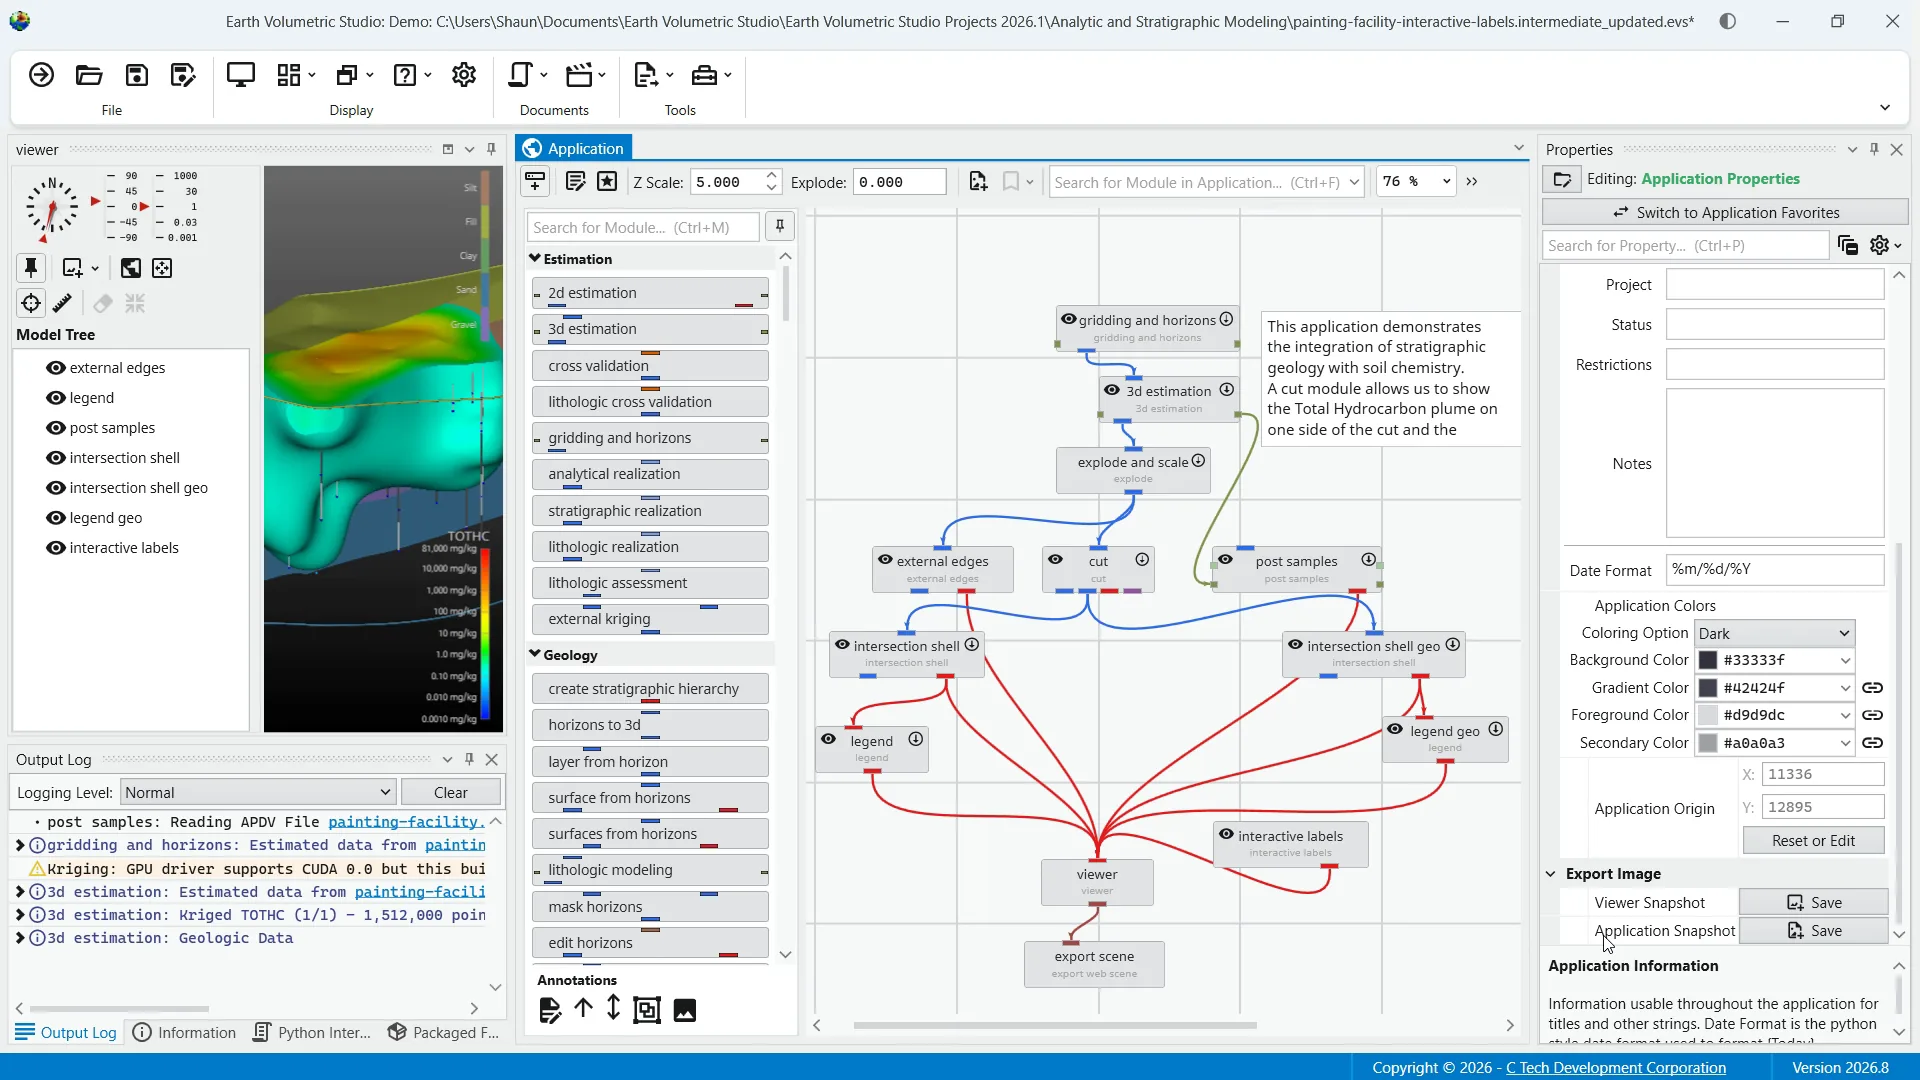
First, we'll look at the properties for the application itself. If you have a module or port selected, you can double-click anywhere on the background in the network area to access the application properties.
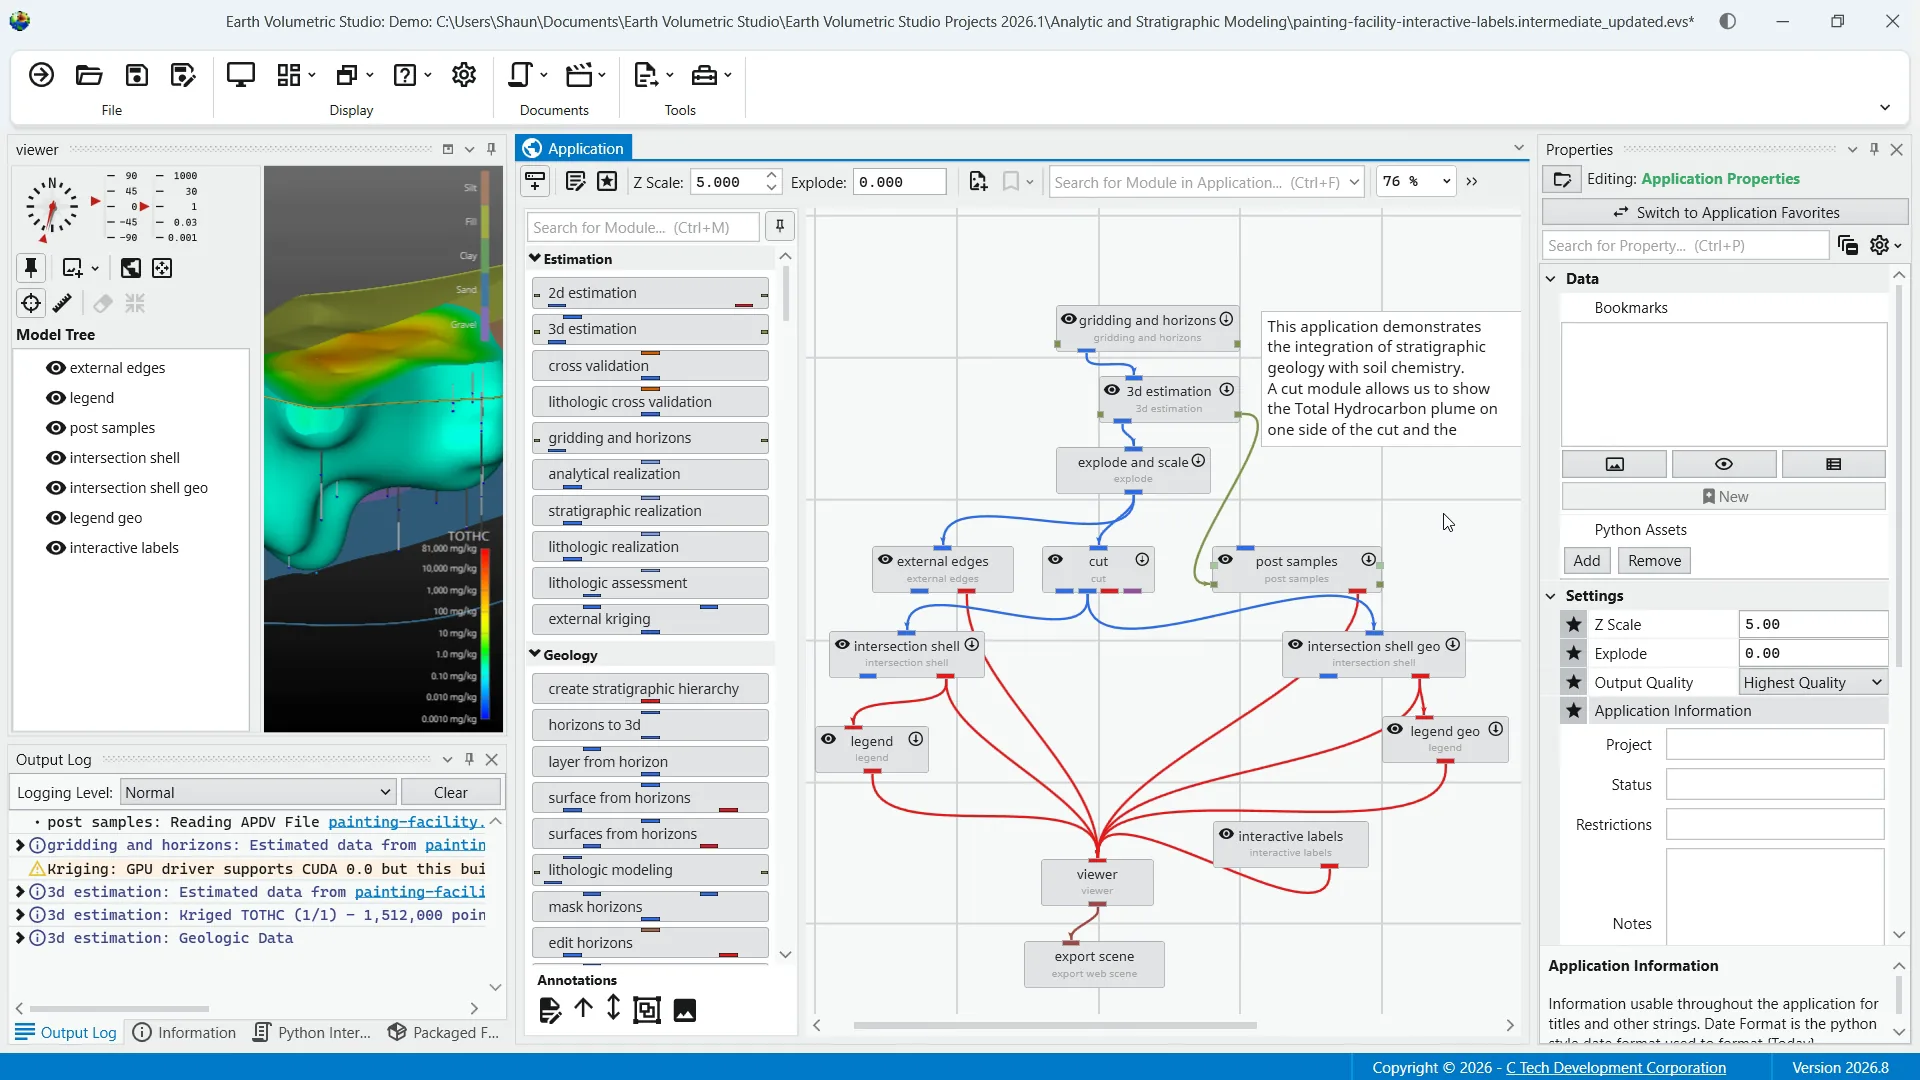
You'll see each category is collapsible and expandable for viewing preference. Let's quickly overview some of these properties. You have bookmarks at the top to manage or save bookmarks. It is here you can save and recall specific configurations of your application. They act as snapshots that can instantly change views, visibility of objects, and the current state of sequences.
These bookmarks can also be exported to CTEC web scenes to optimize user experience.
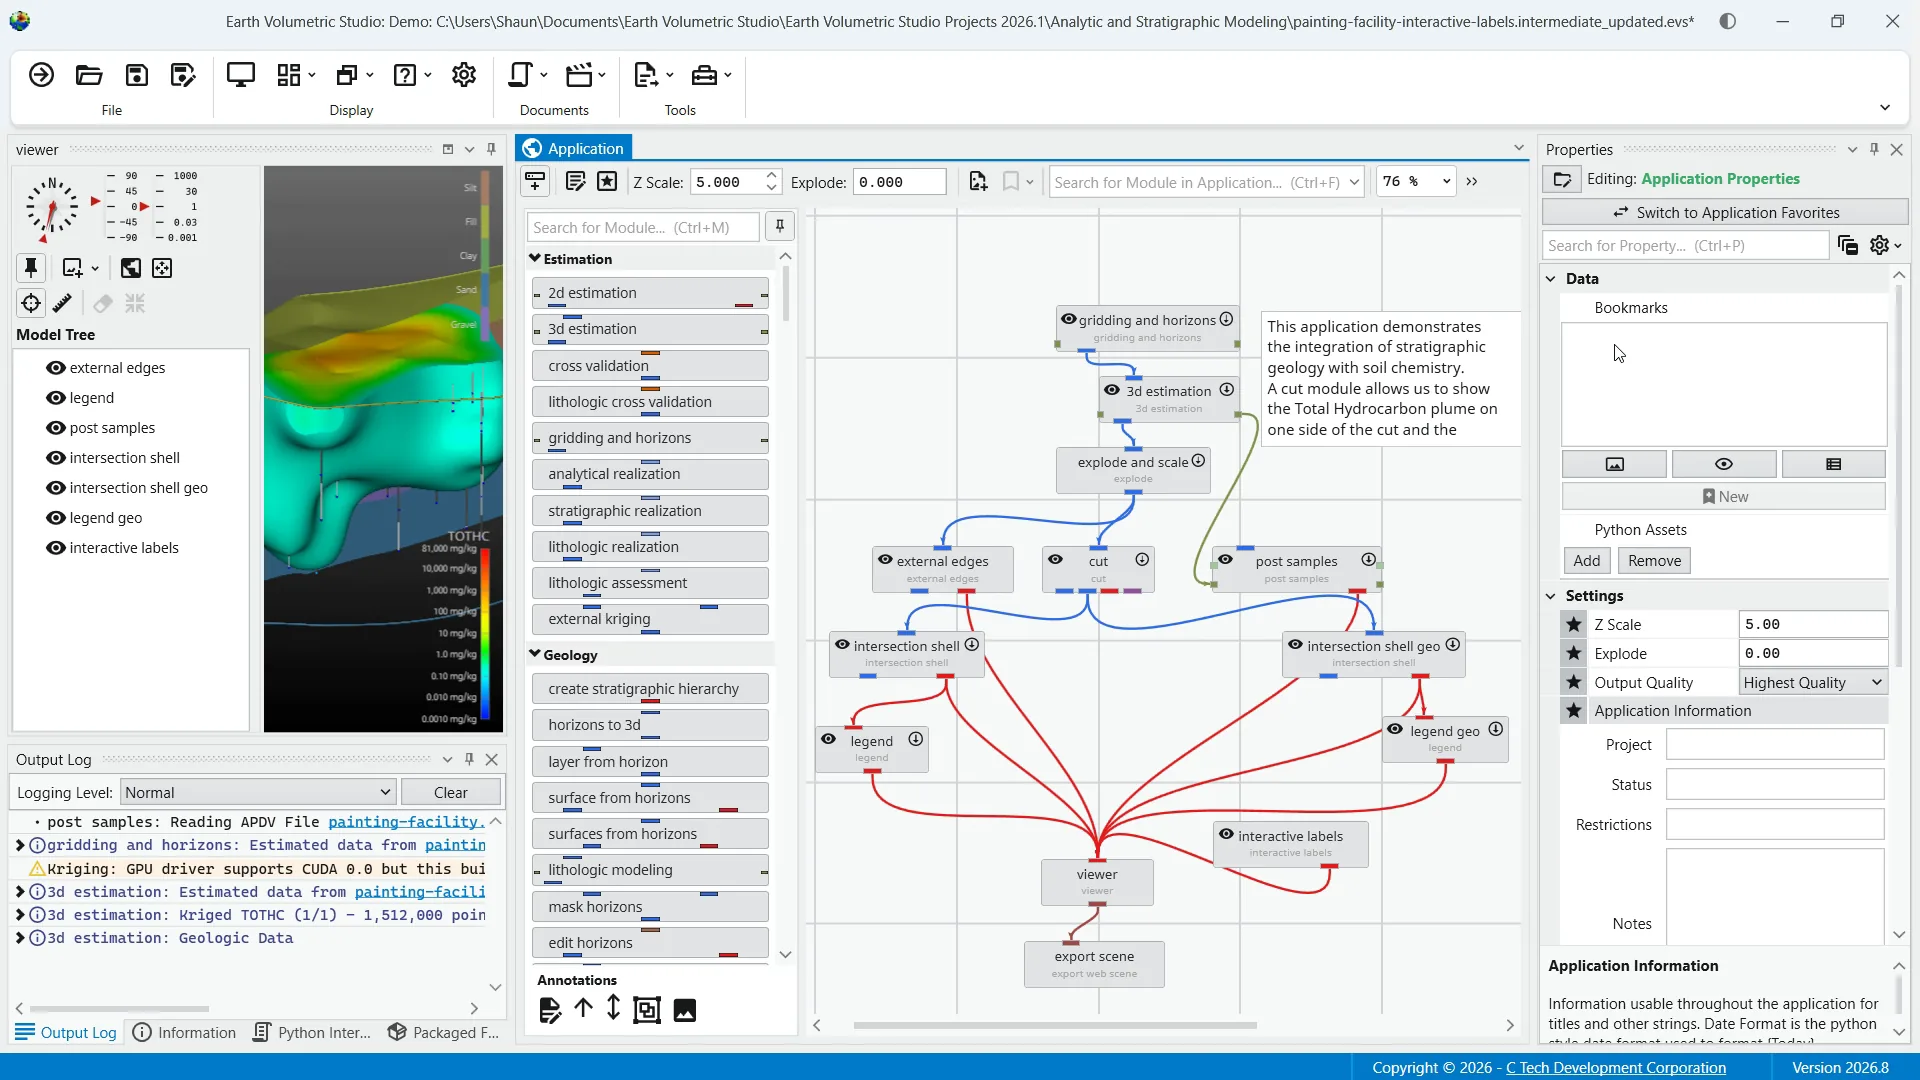
Beneath that, you have Python assets where you can add Python scripts from other Python files in your application.
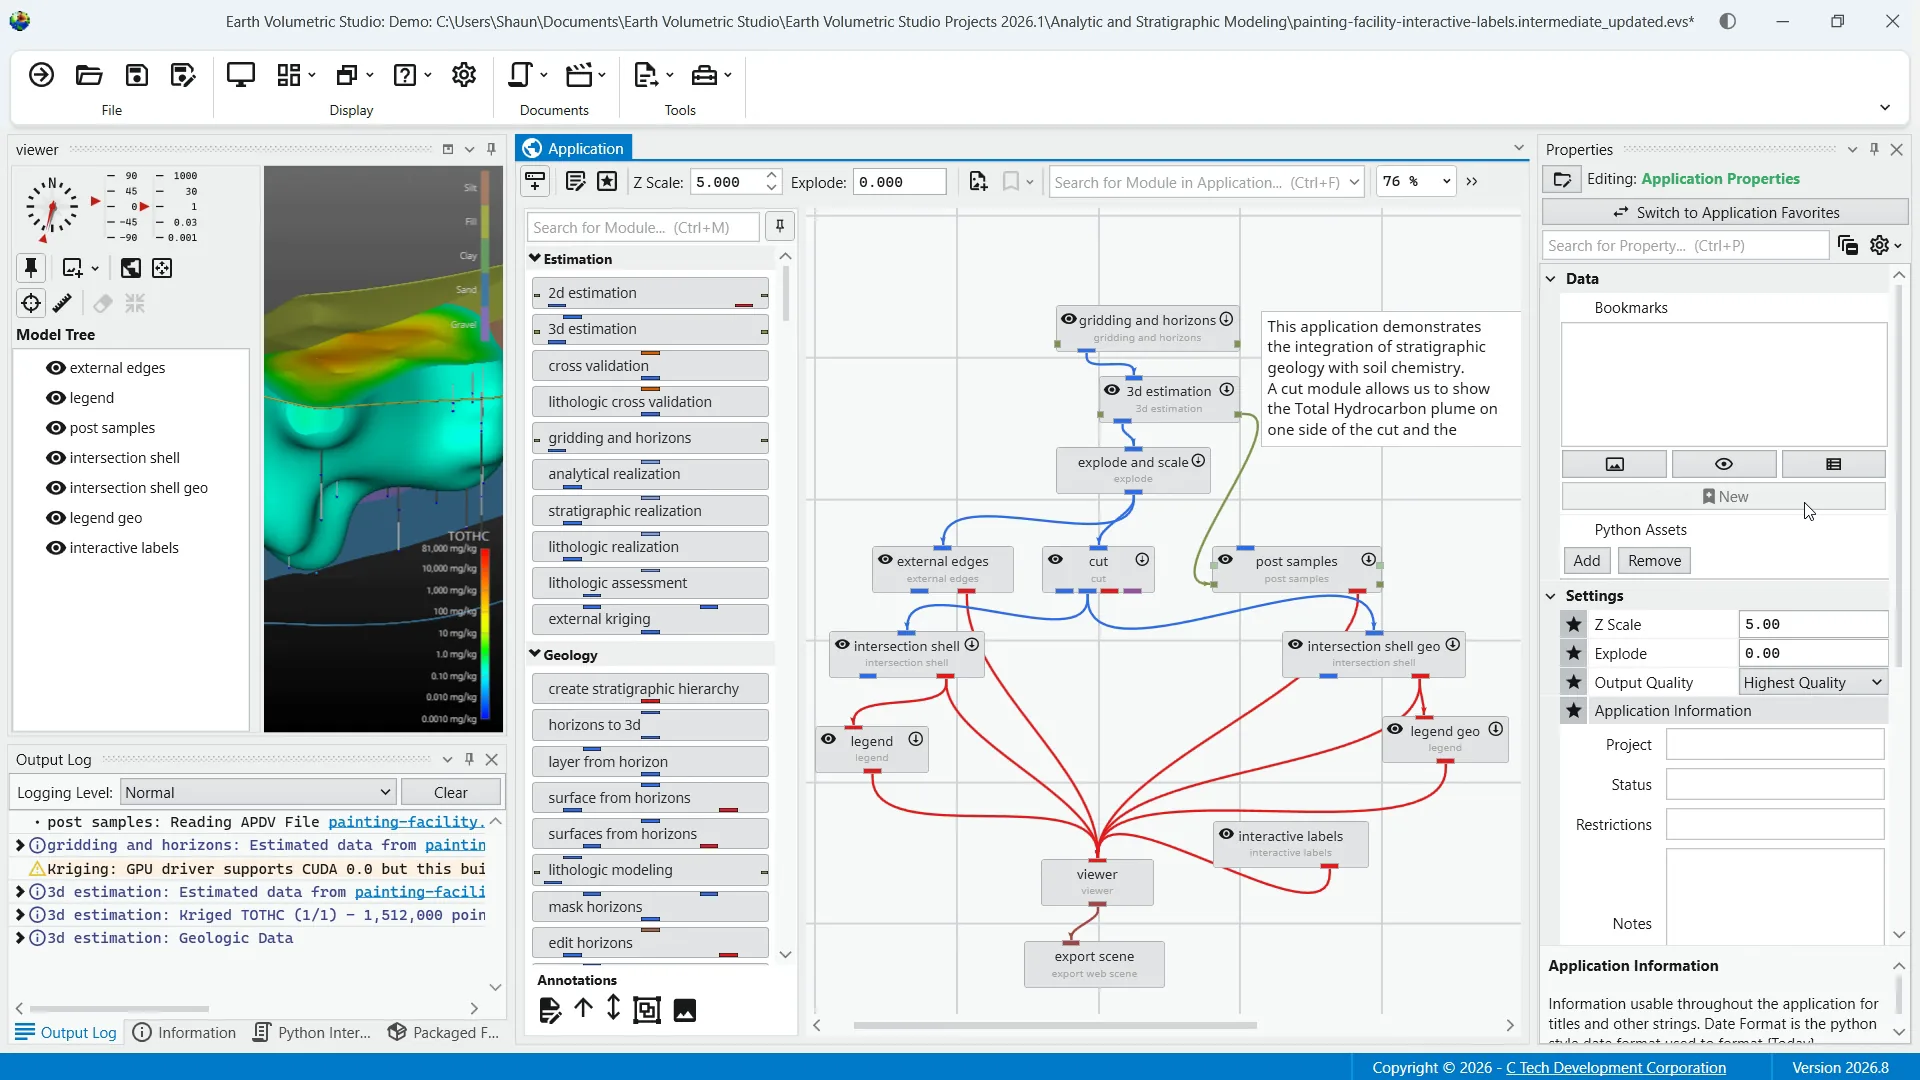
Z scale adjusts the vertical exaggeration of the 3D model. Explode controls the separation of layered data components You have output quality options, application information as a means to supply metadata for outputs and scripts, and application colors to customize the appearance of module outputs.
This feature provides a centralized way to manage a consistent color palette across your entire application, which is also ideal when used with link properties, as it allows you to switch between entire color themes with a single click. Linking will be discussed momentarily when we look at module properties.
Next, we have application origin to define the spatial anchor for the project coordinates. This is something you can reset or edit to manually calibrate the center of your project. Viewer snapshot writes the contents of the viewer to an image file.
And finally, Application Snapshot writes the content of the application window, also to an image file.
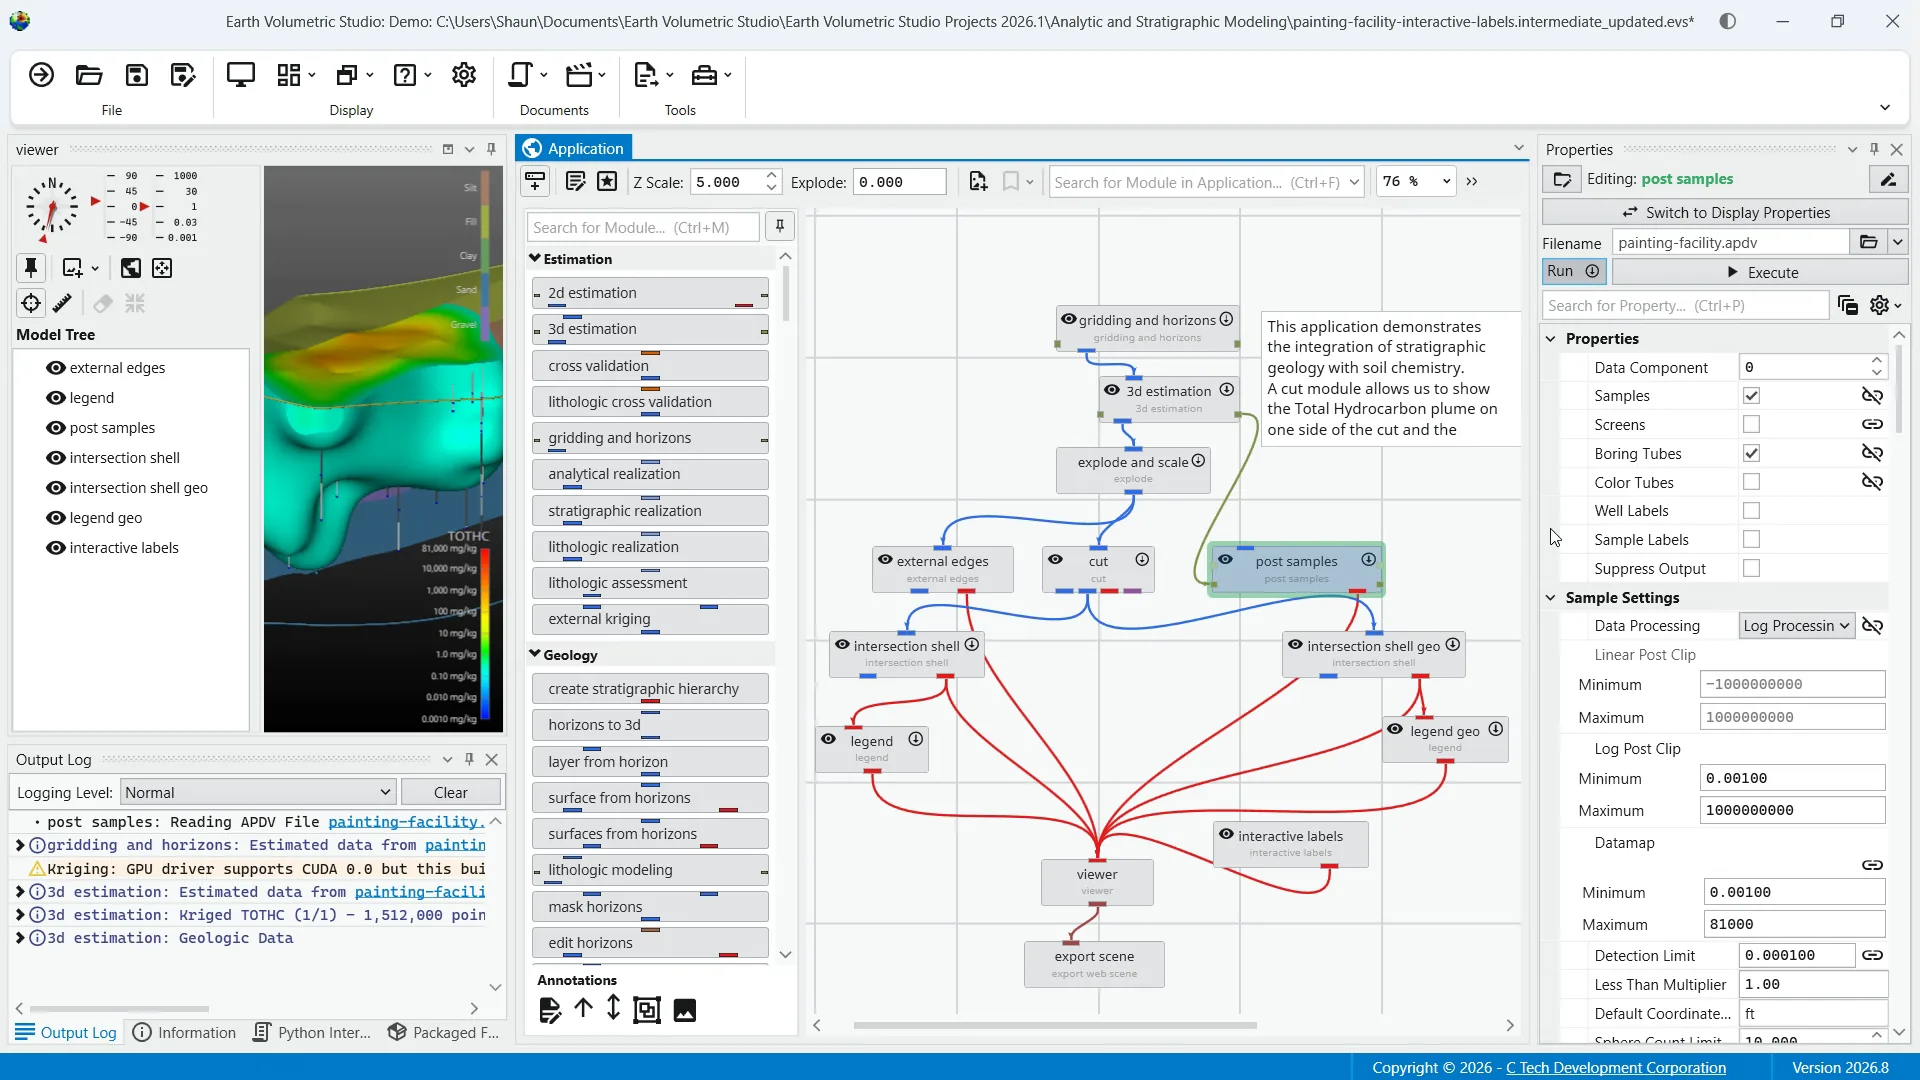
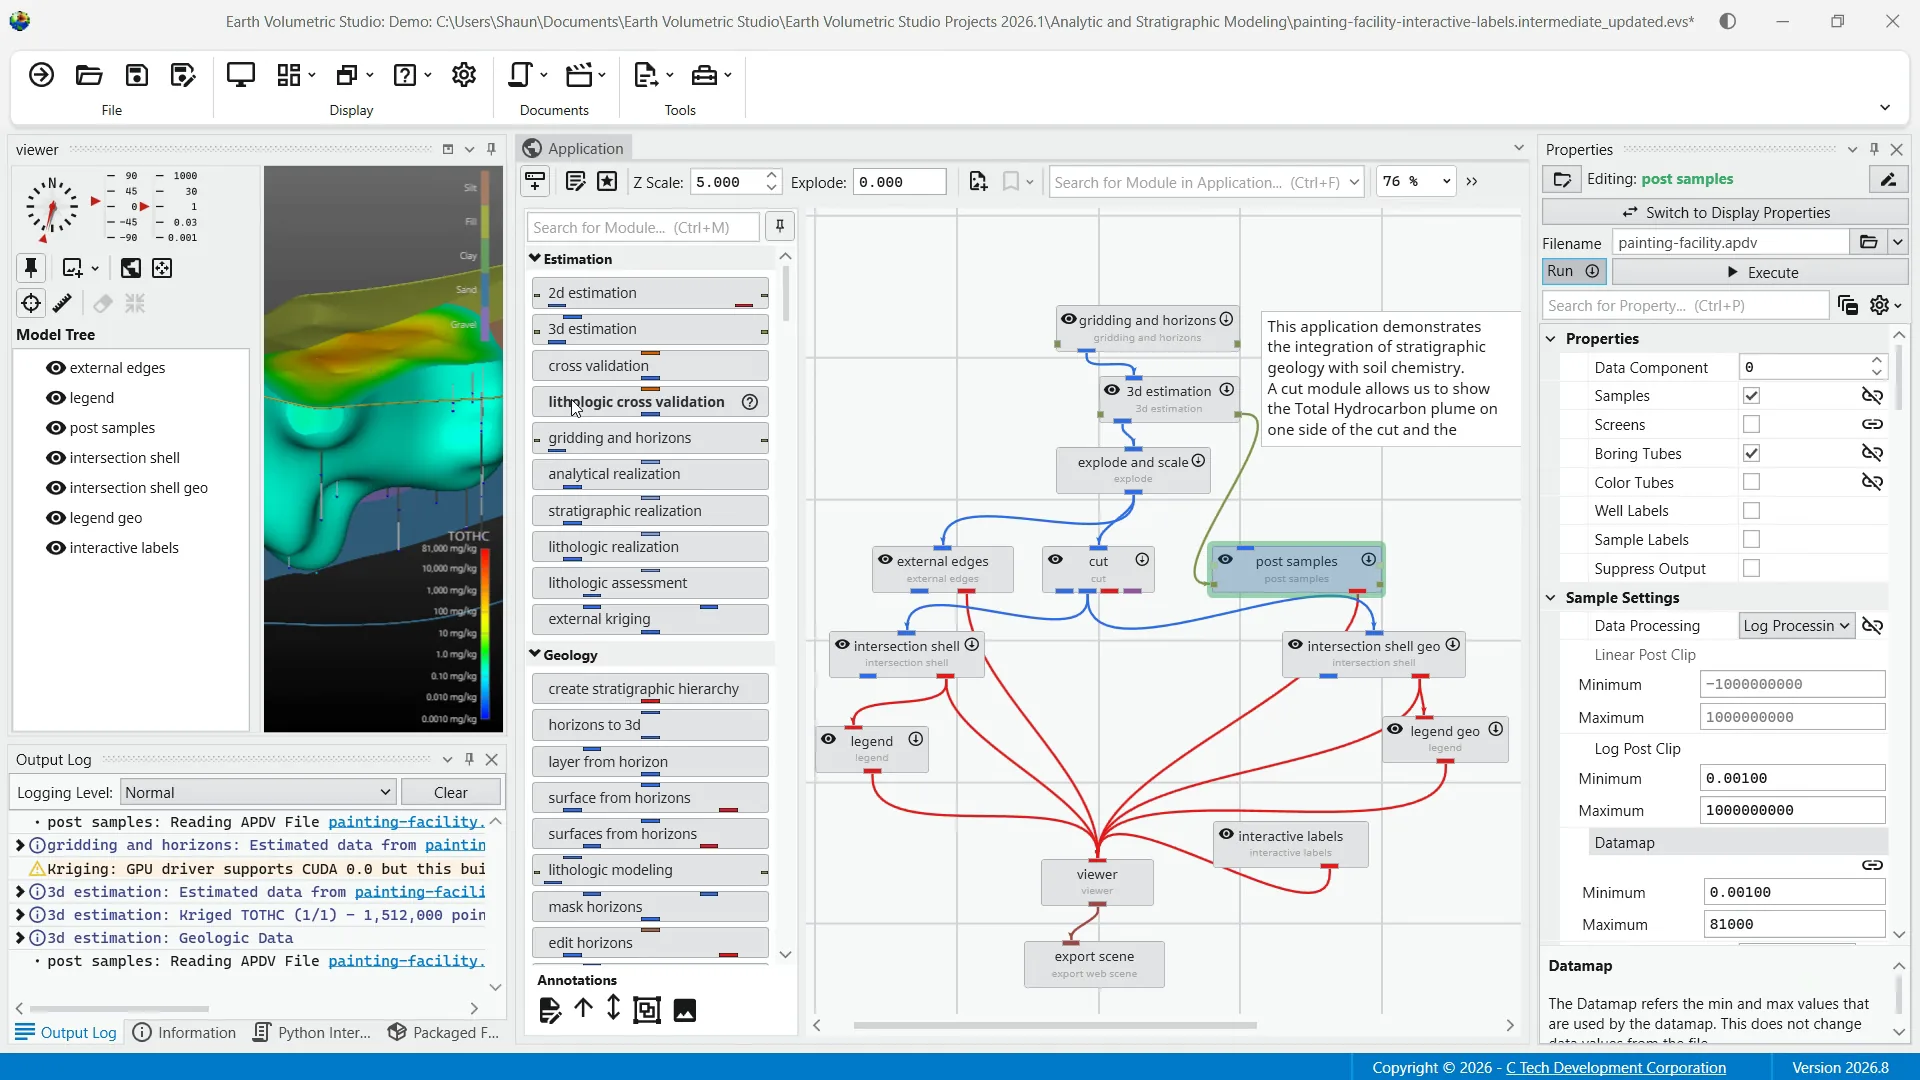
As mentioned previously, when you select a module in the application network, its settings are now displayed in the Properties window.
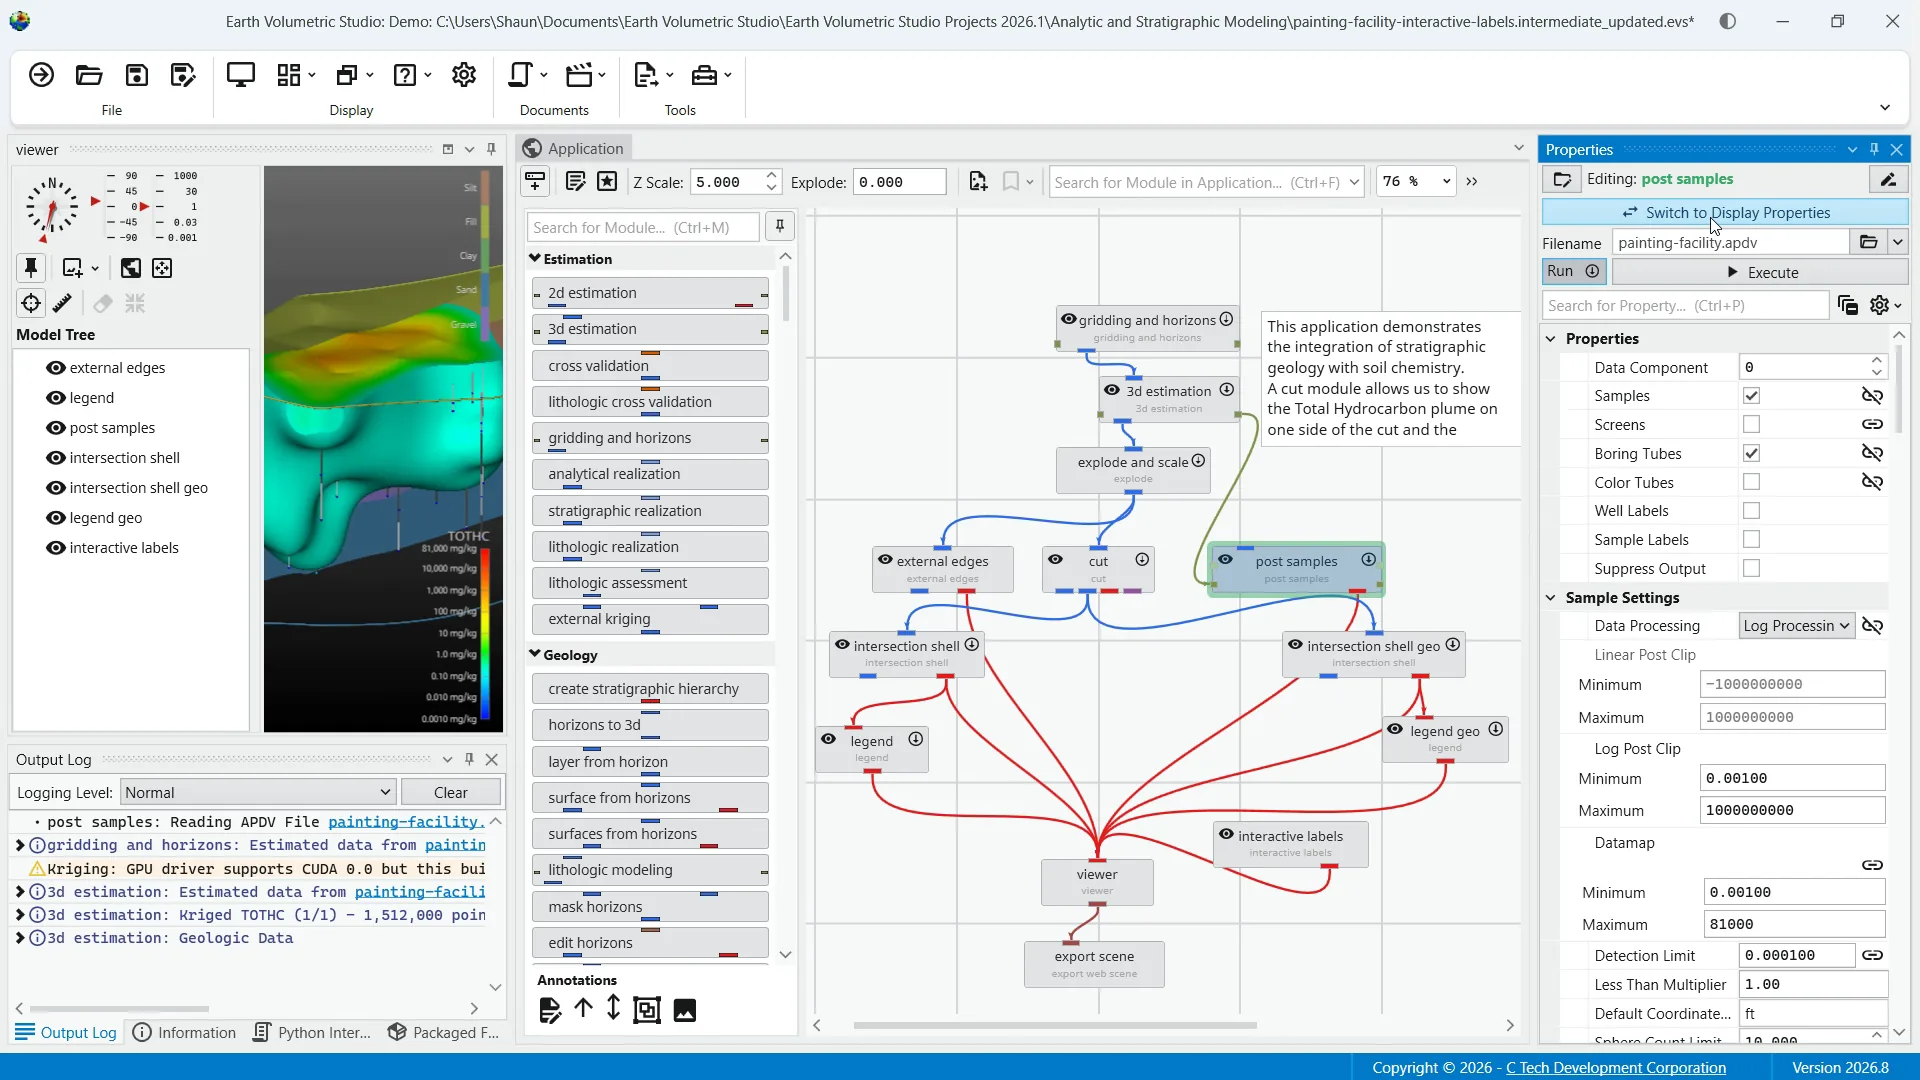
This allows you to configure the module's parameters and control its execution behavior. We already touched on the function of the switch to display properties button to quickly toggle between module properties and output port properties for that module.
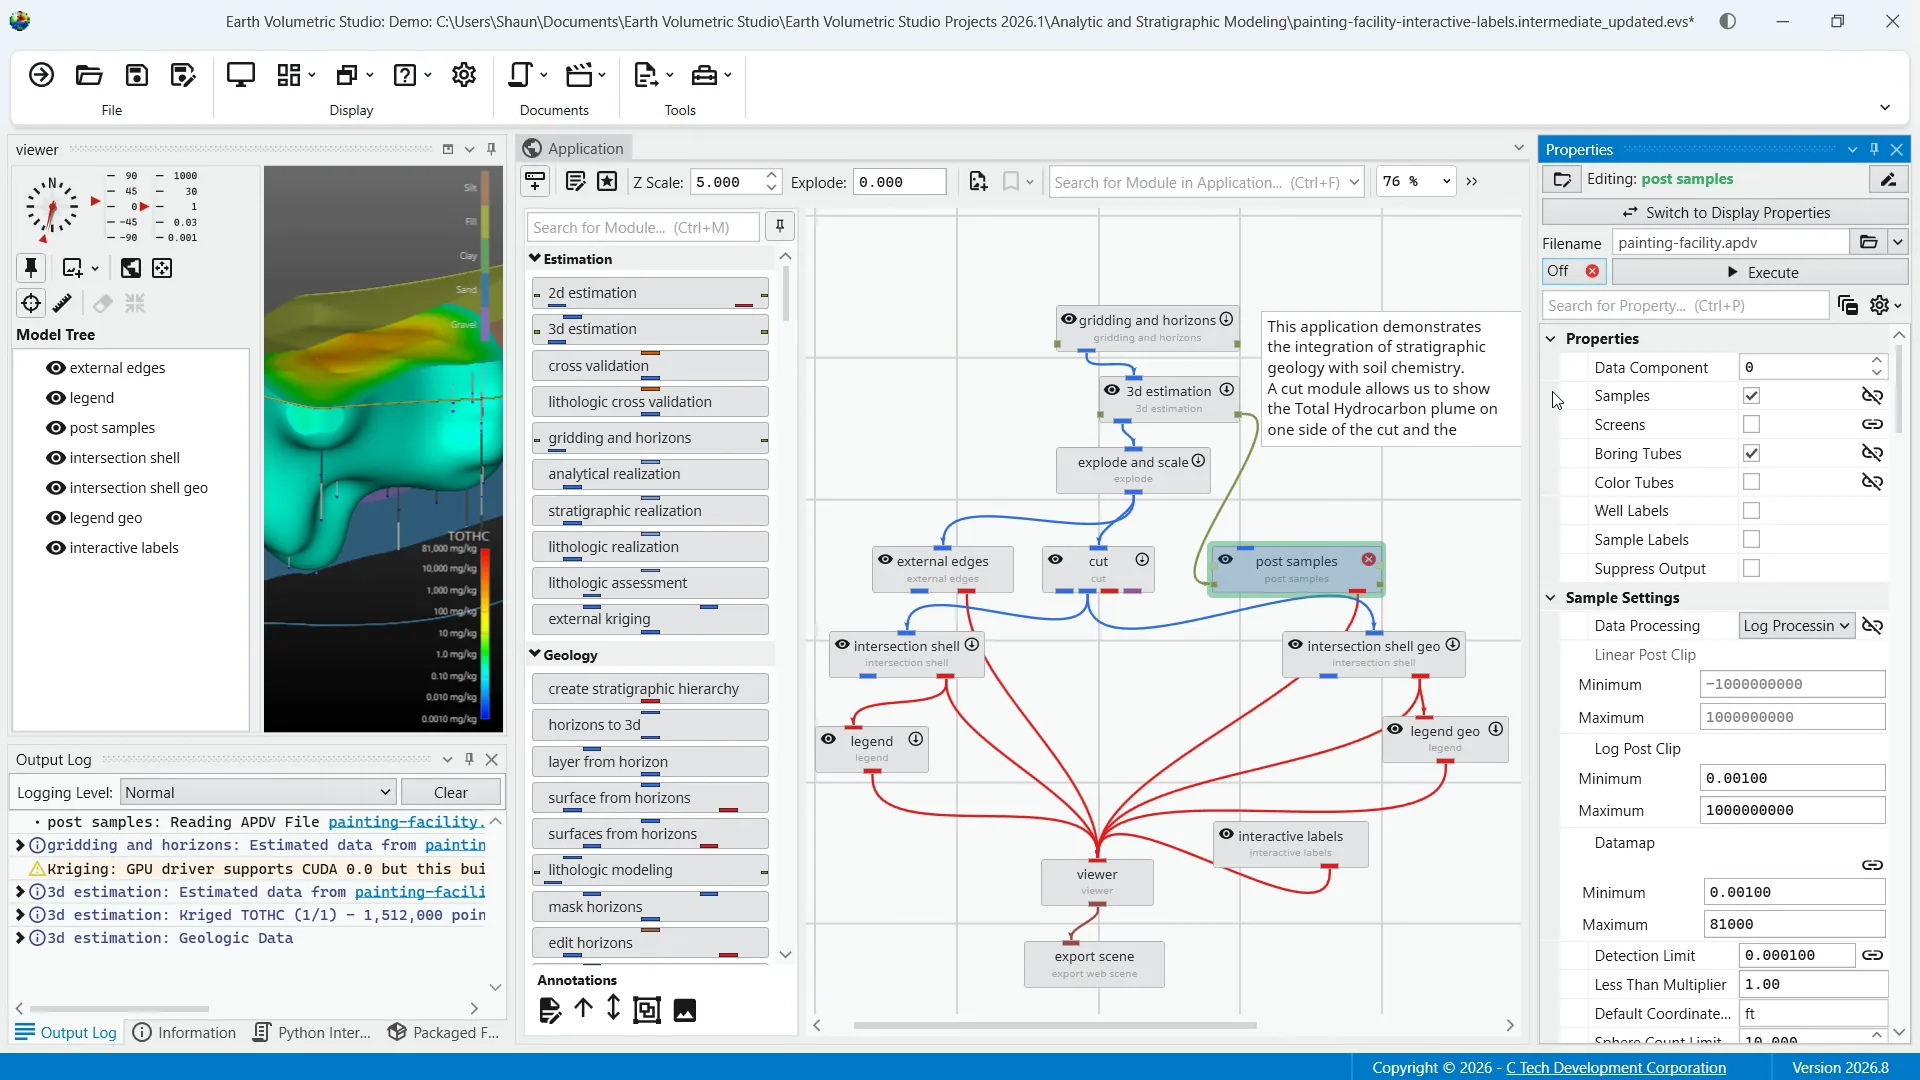
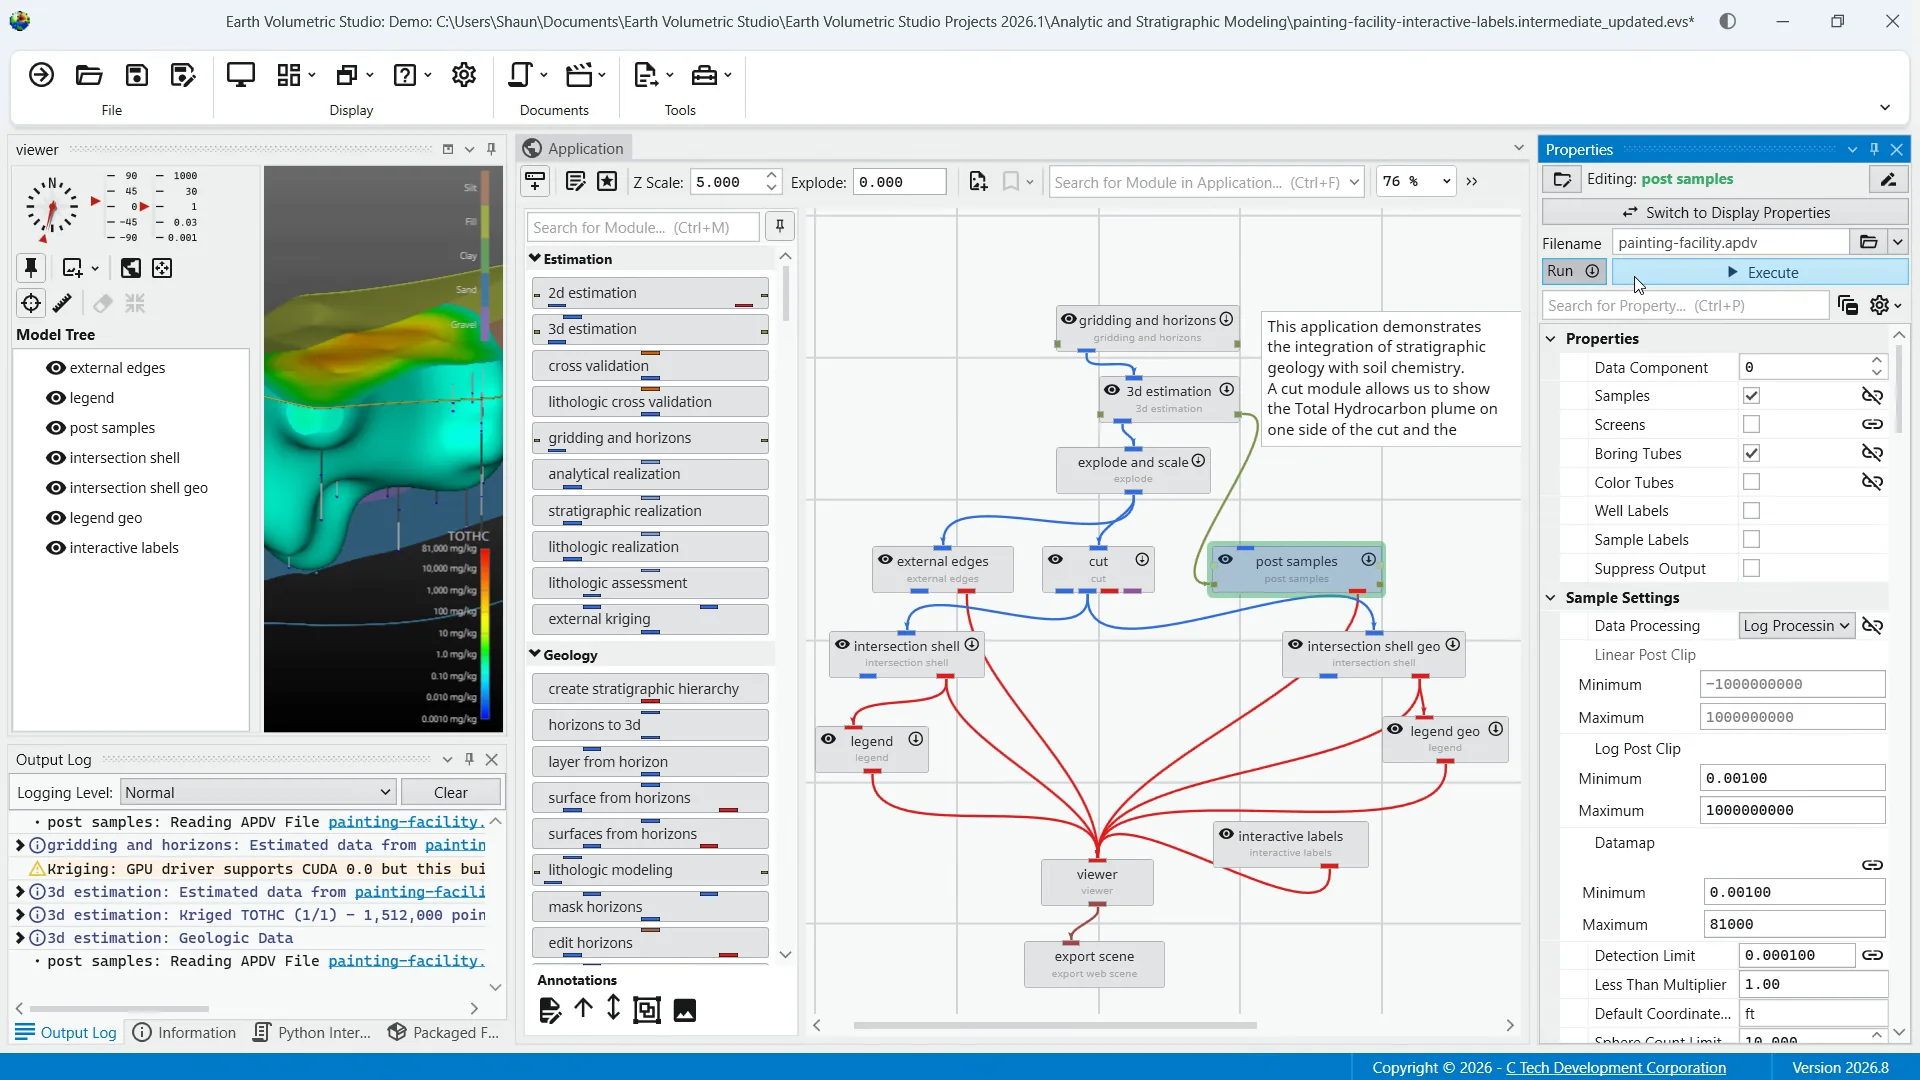
Beneath that you have execution control tools. The run toggle controls the module's automatic execution. By default this is always on, meaning the module will automatically run whenever one of its properties has changed, or when an upstream module it depends on finishes running. Toggling this off prevents the module from running automatically.
This is also displayed on the module in the application network. The "execute" button allows you to manually trigger the execution of the currently selected module. It essentially forces the module to run a single time, which can be useful when the run toggle is off, as it lets you apply your changes and see the result without having to re-enable automatic execution.
Below the execution controls and the search bar, the properties sections contain all of the configurable parameters for the selected module. These settings are unique to each module's function and allow you to customize the module's behavior to fit the specific need of your analysis. An important part of this customization is the ability to link and unlink properties.
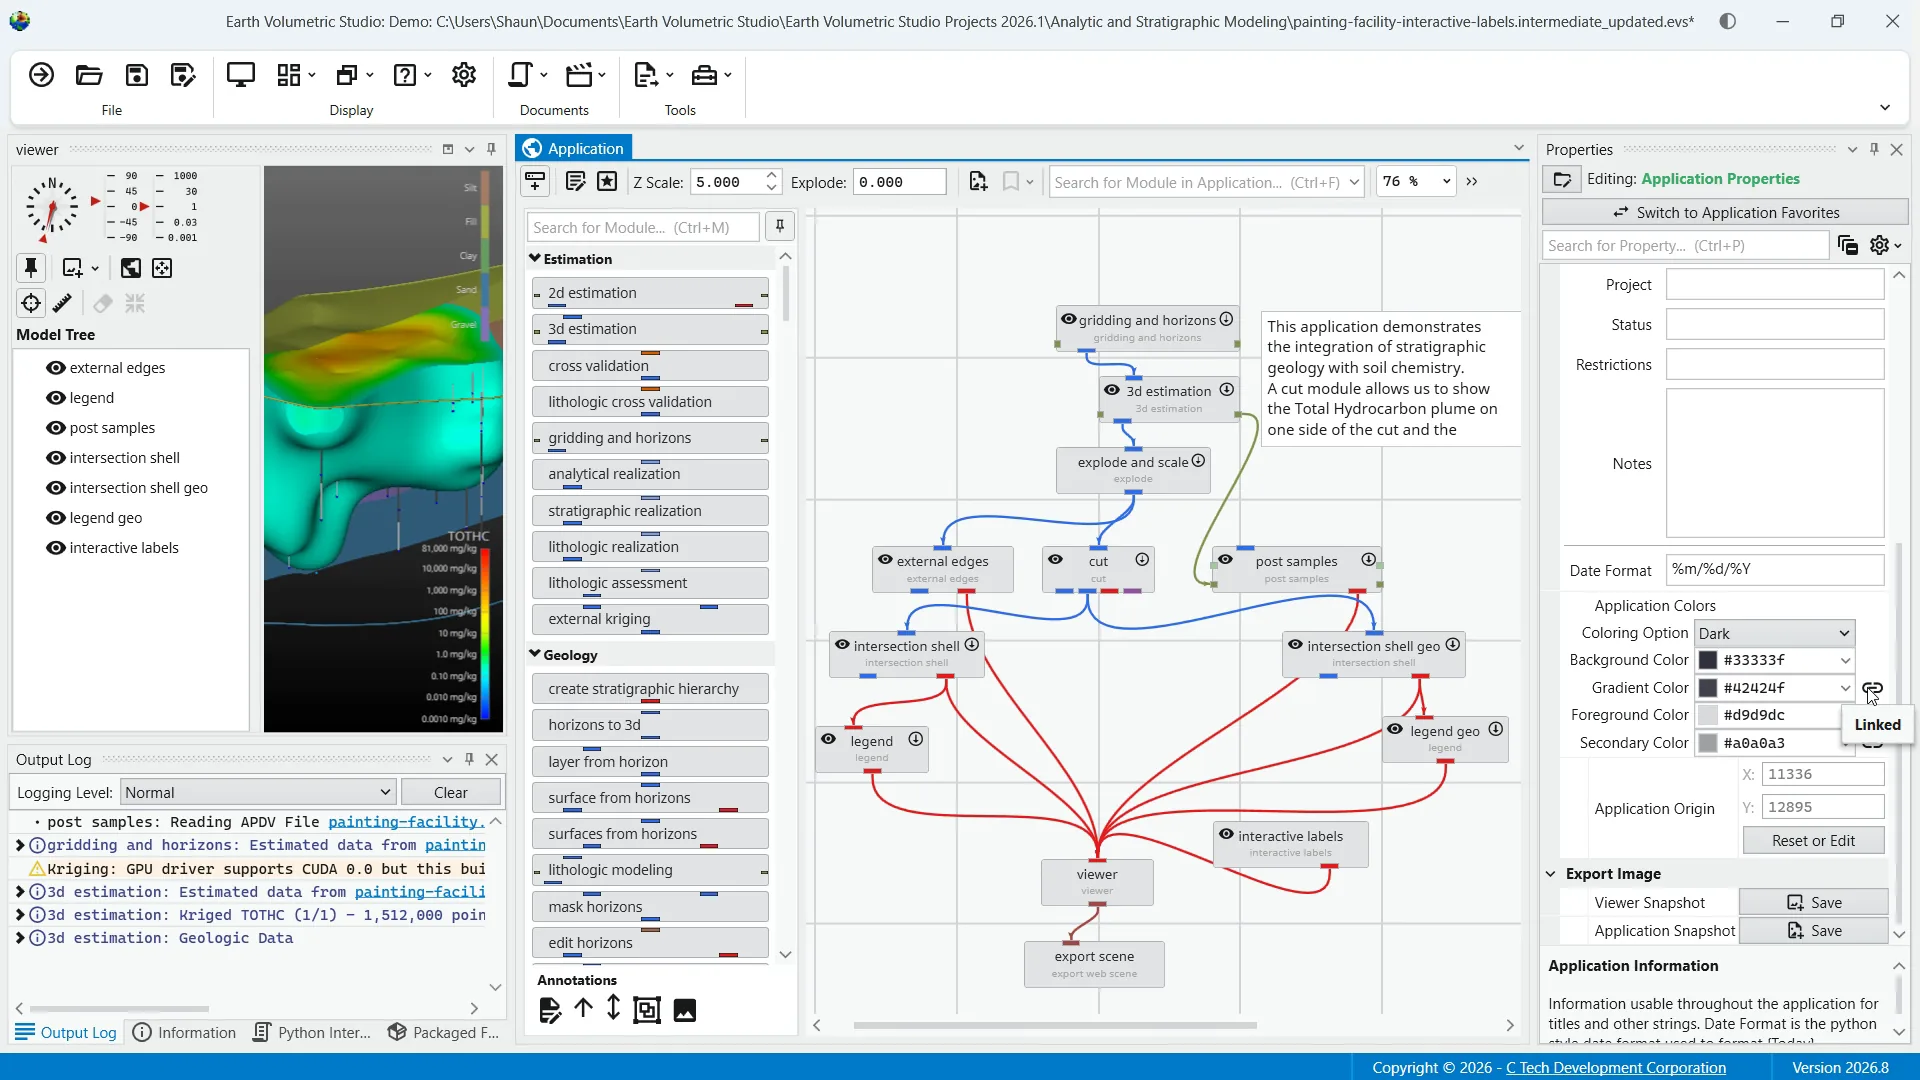
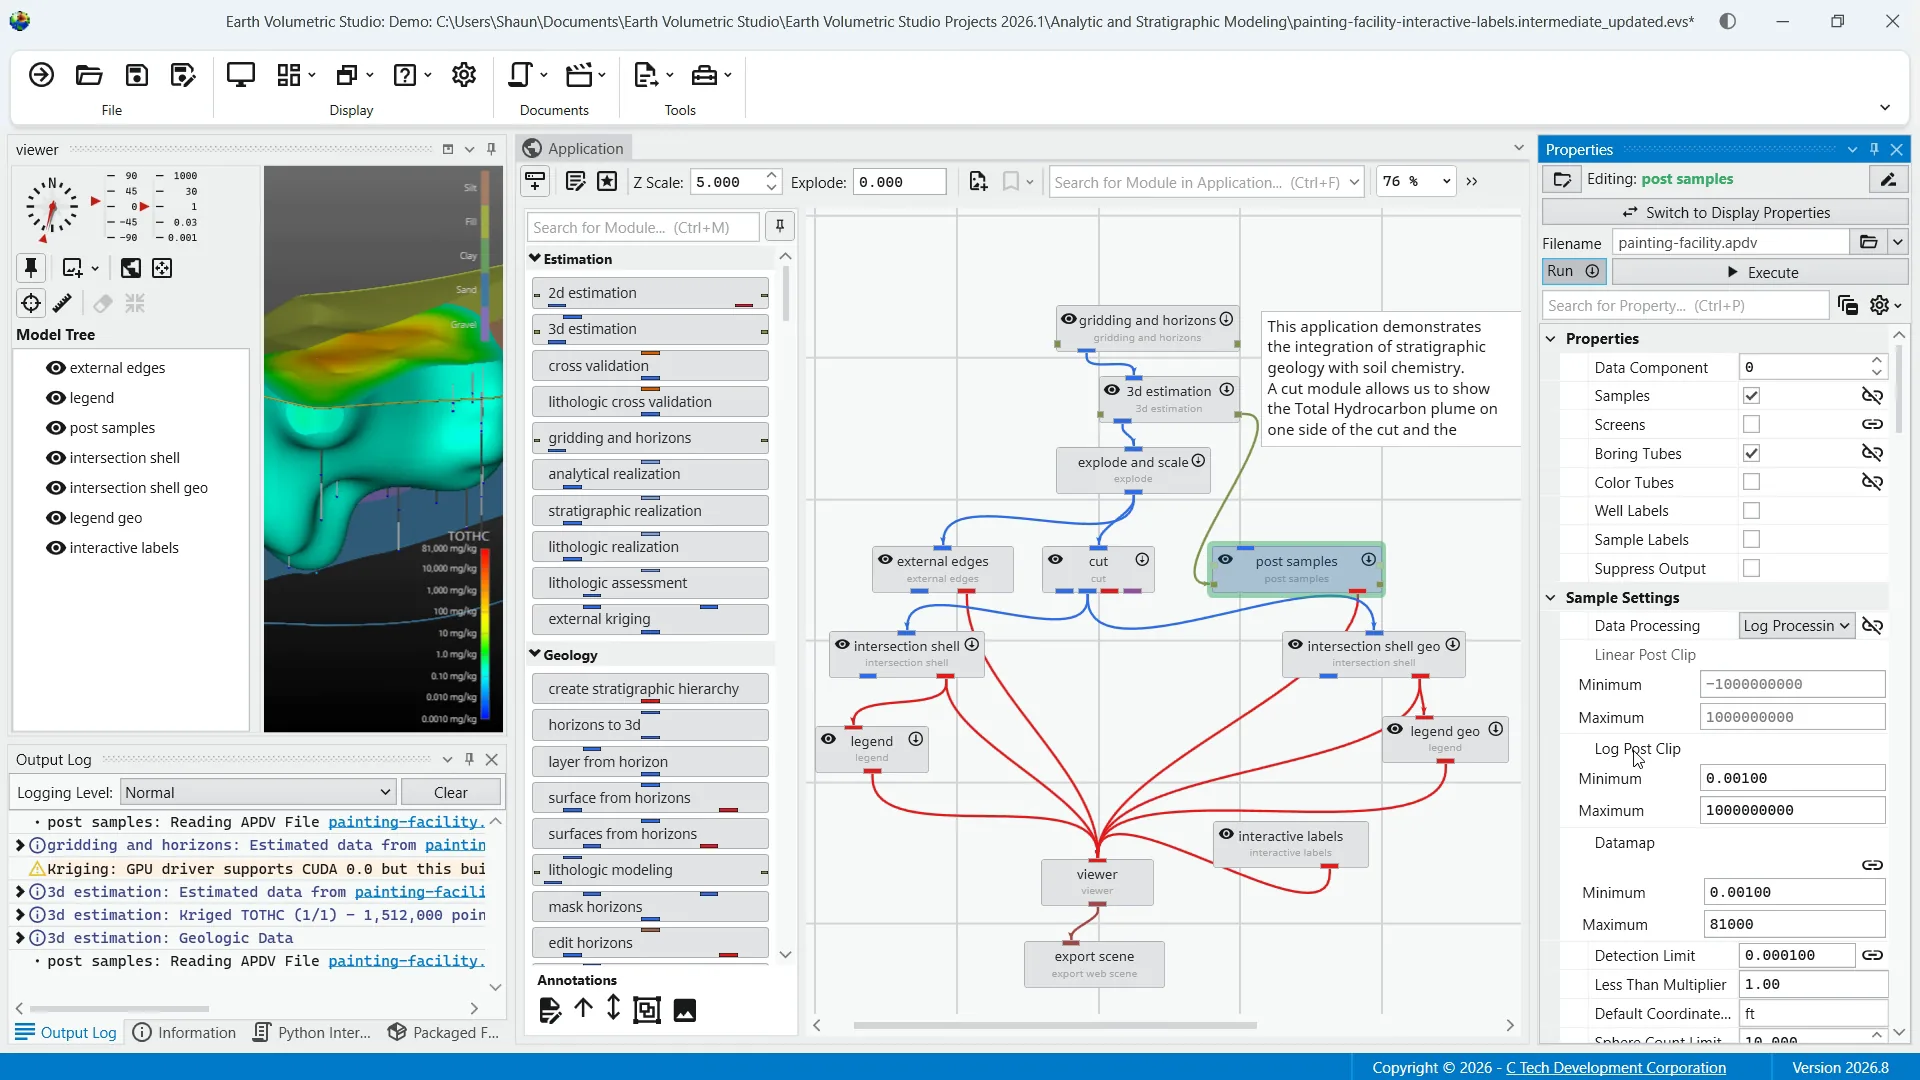
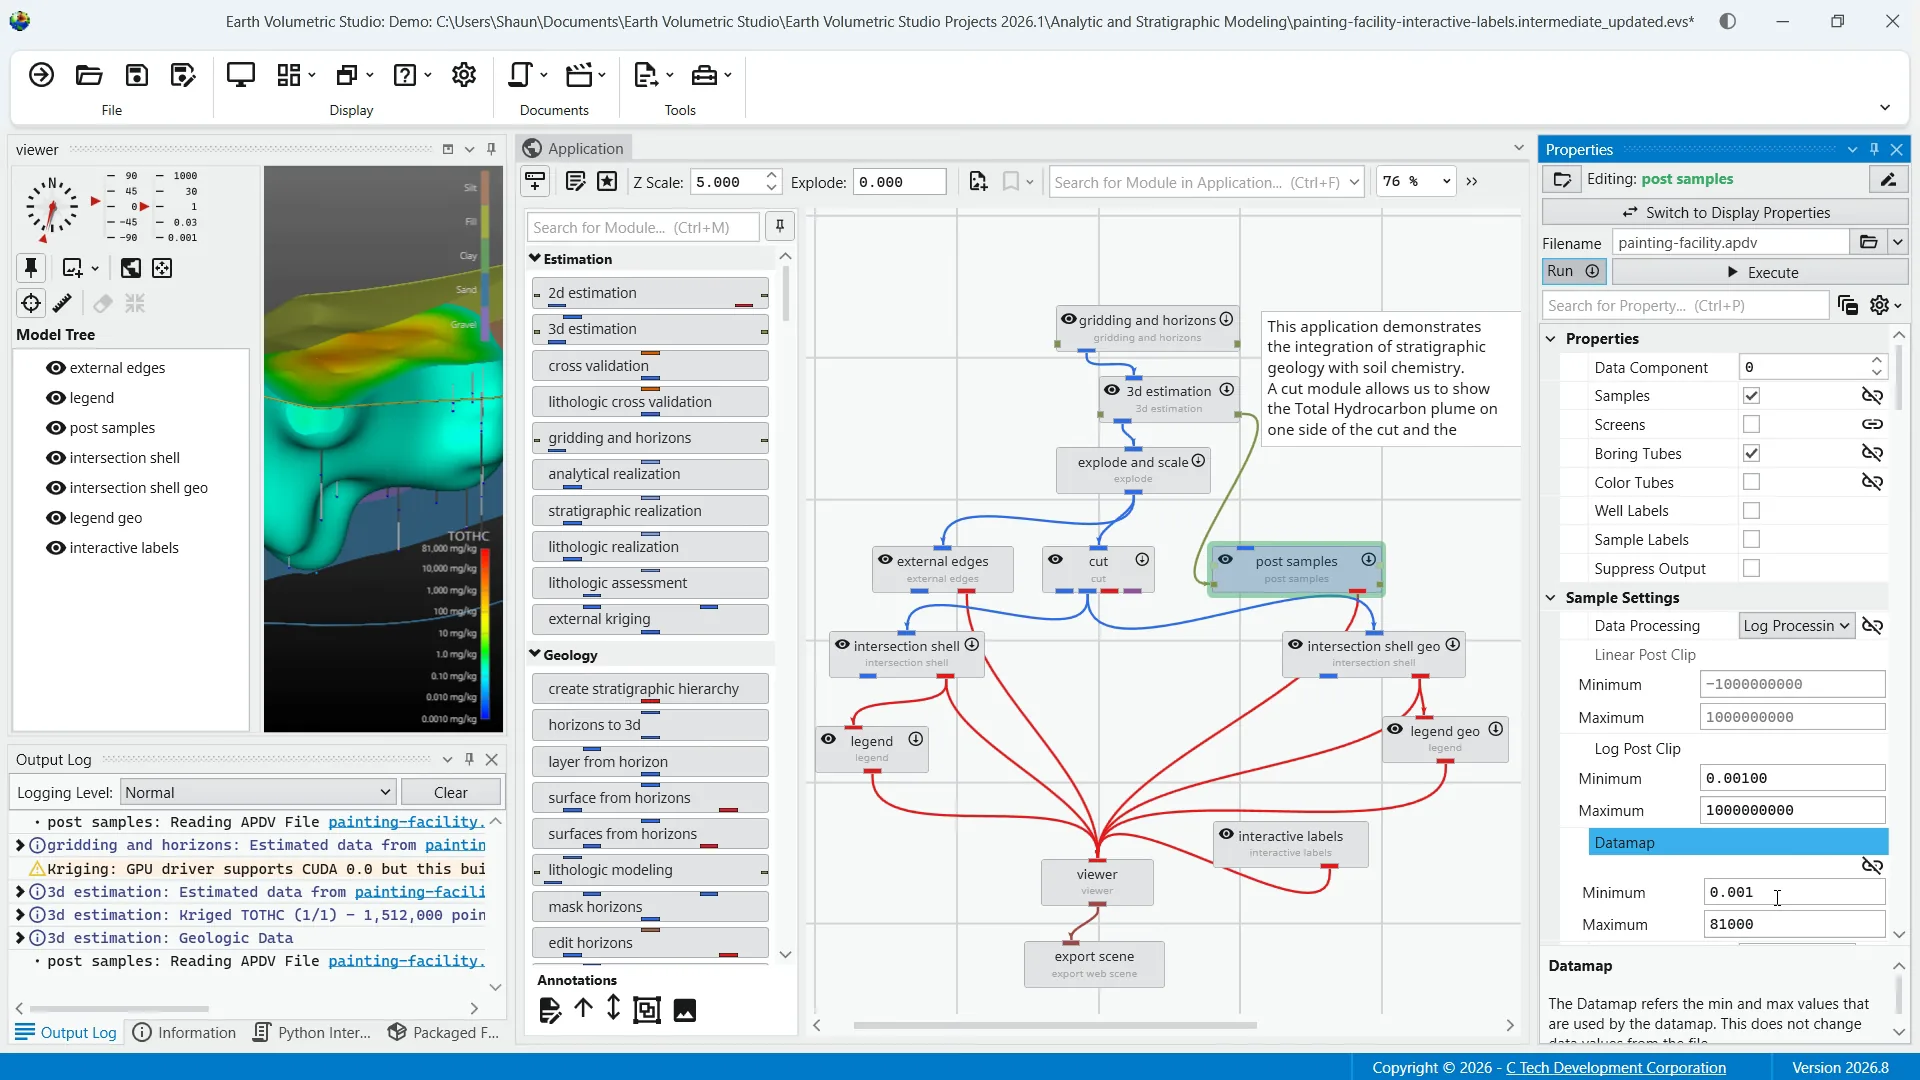
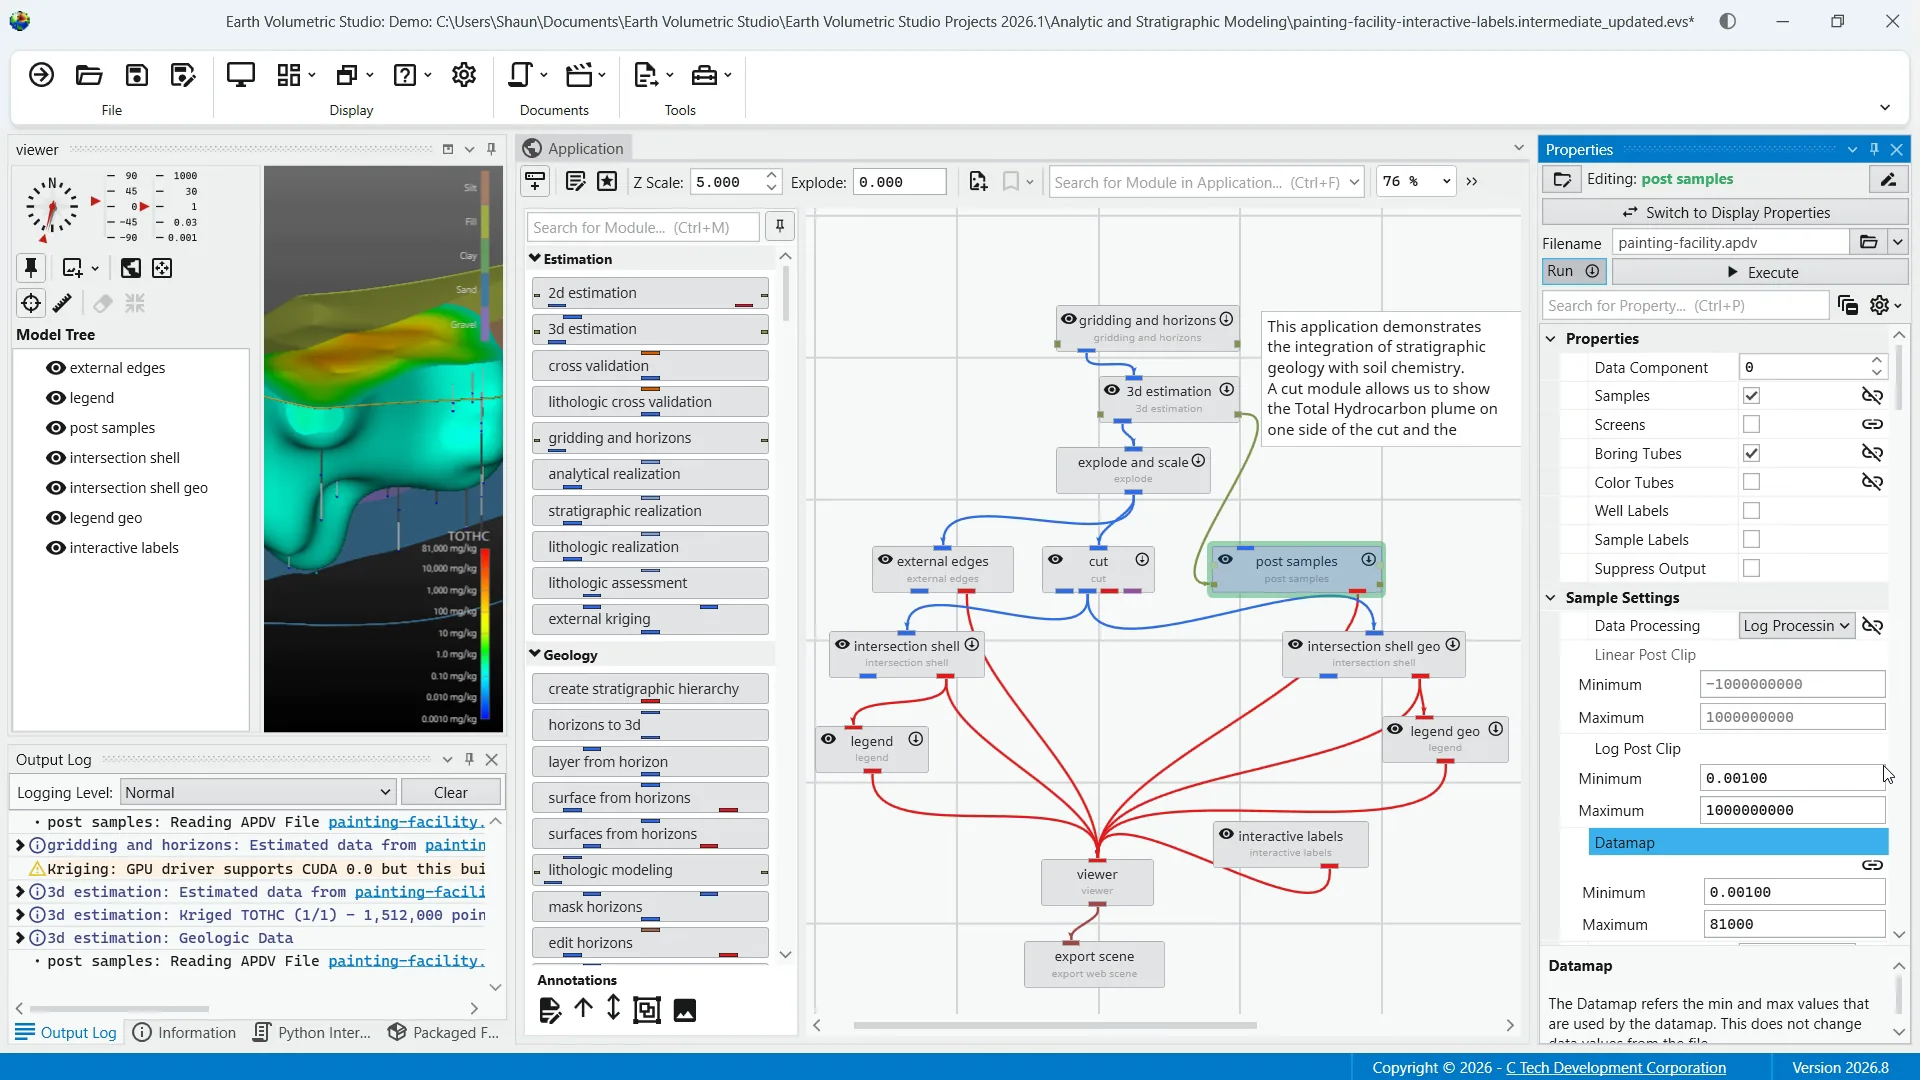
Linking as shown with this icon is when a parameter's value is automatically determined within the application rather than being set by the user. This dynamic connection allows for a more intelligent, consistent workflow by having the value automatically update based on its source. Conversely, by clicking on the link icon to break the link, you're able to fix a value to whatever you decide to manually set.
While you can unlink a linked property to gain manual control, it's genuinely recommended to keep properties linked unless you have a specific reason and fully understand the effect of the change. It's important to note that not all properties are linked. If there is no link icon next to a property that is set manually by the user, it will not be updated automatically.
Common categories of linked properties are Z scale, coordinates, and the aforementioned application colors.
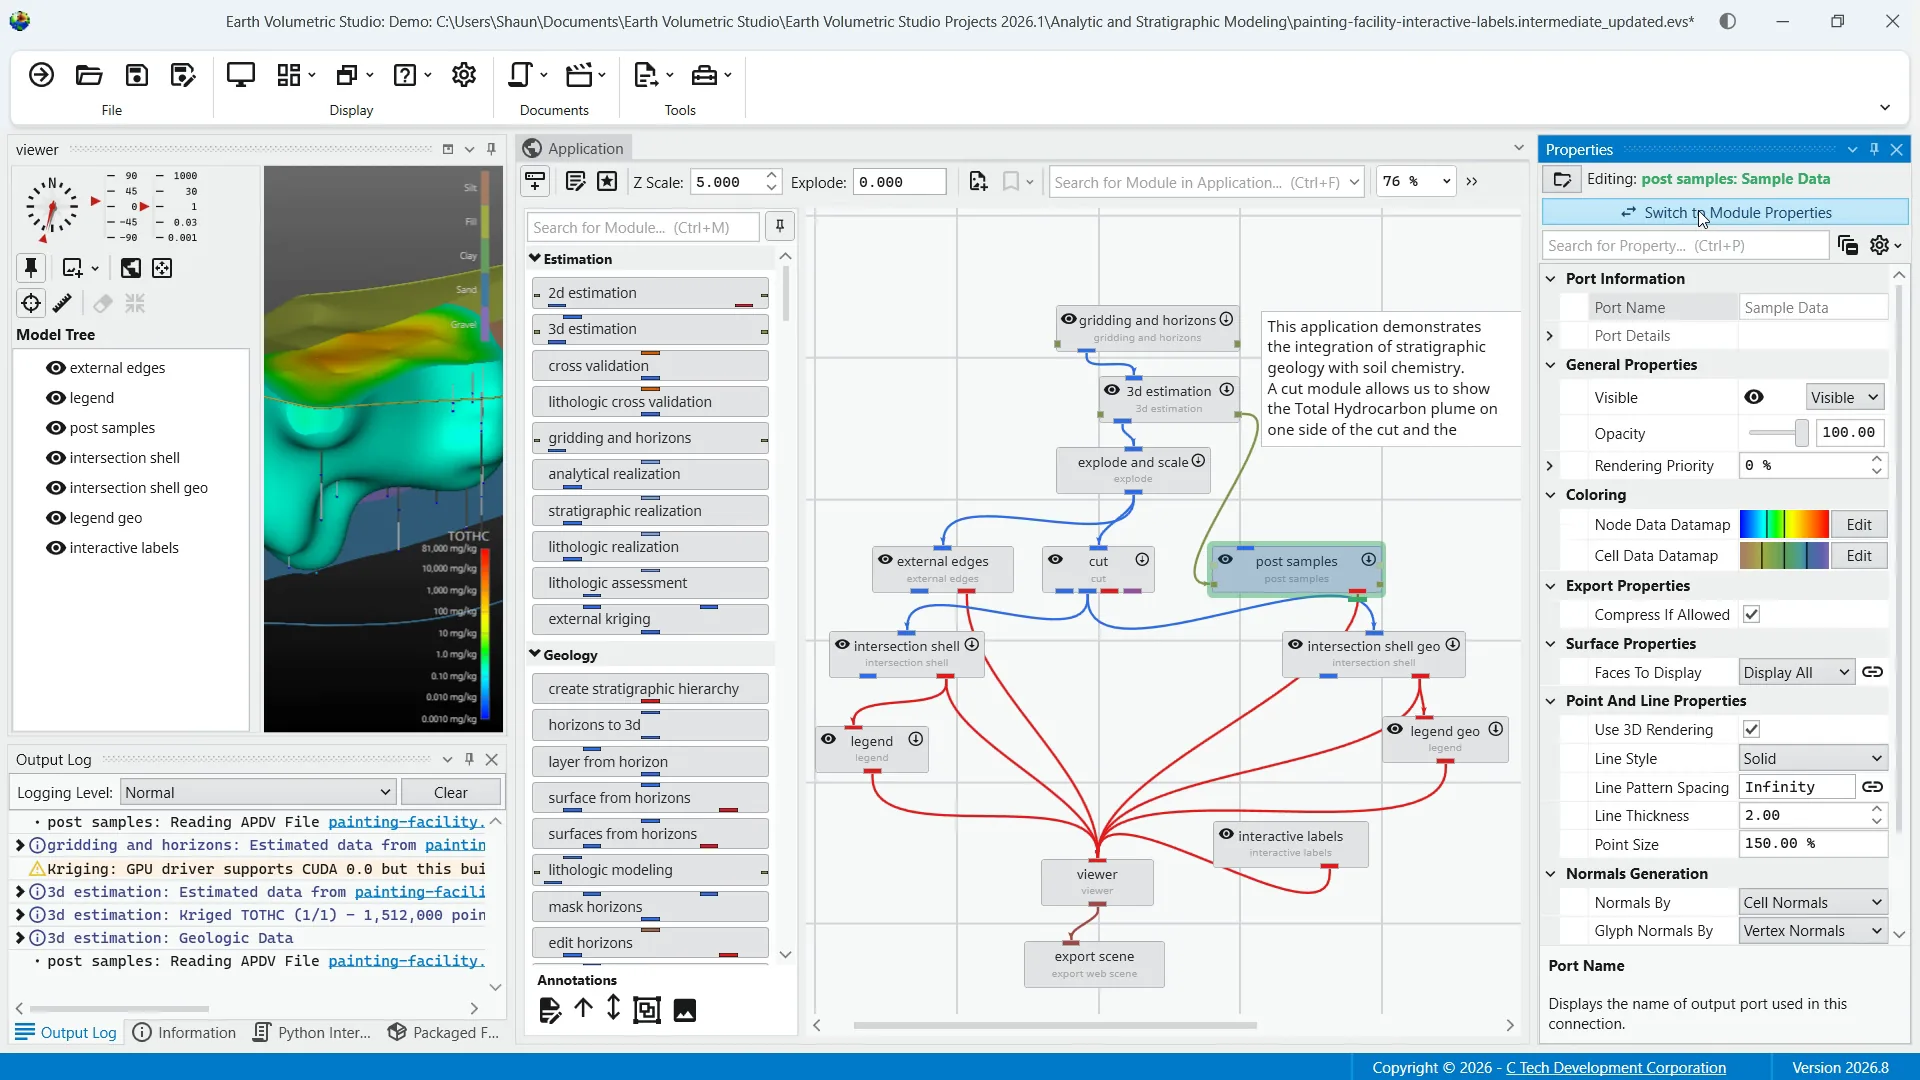
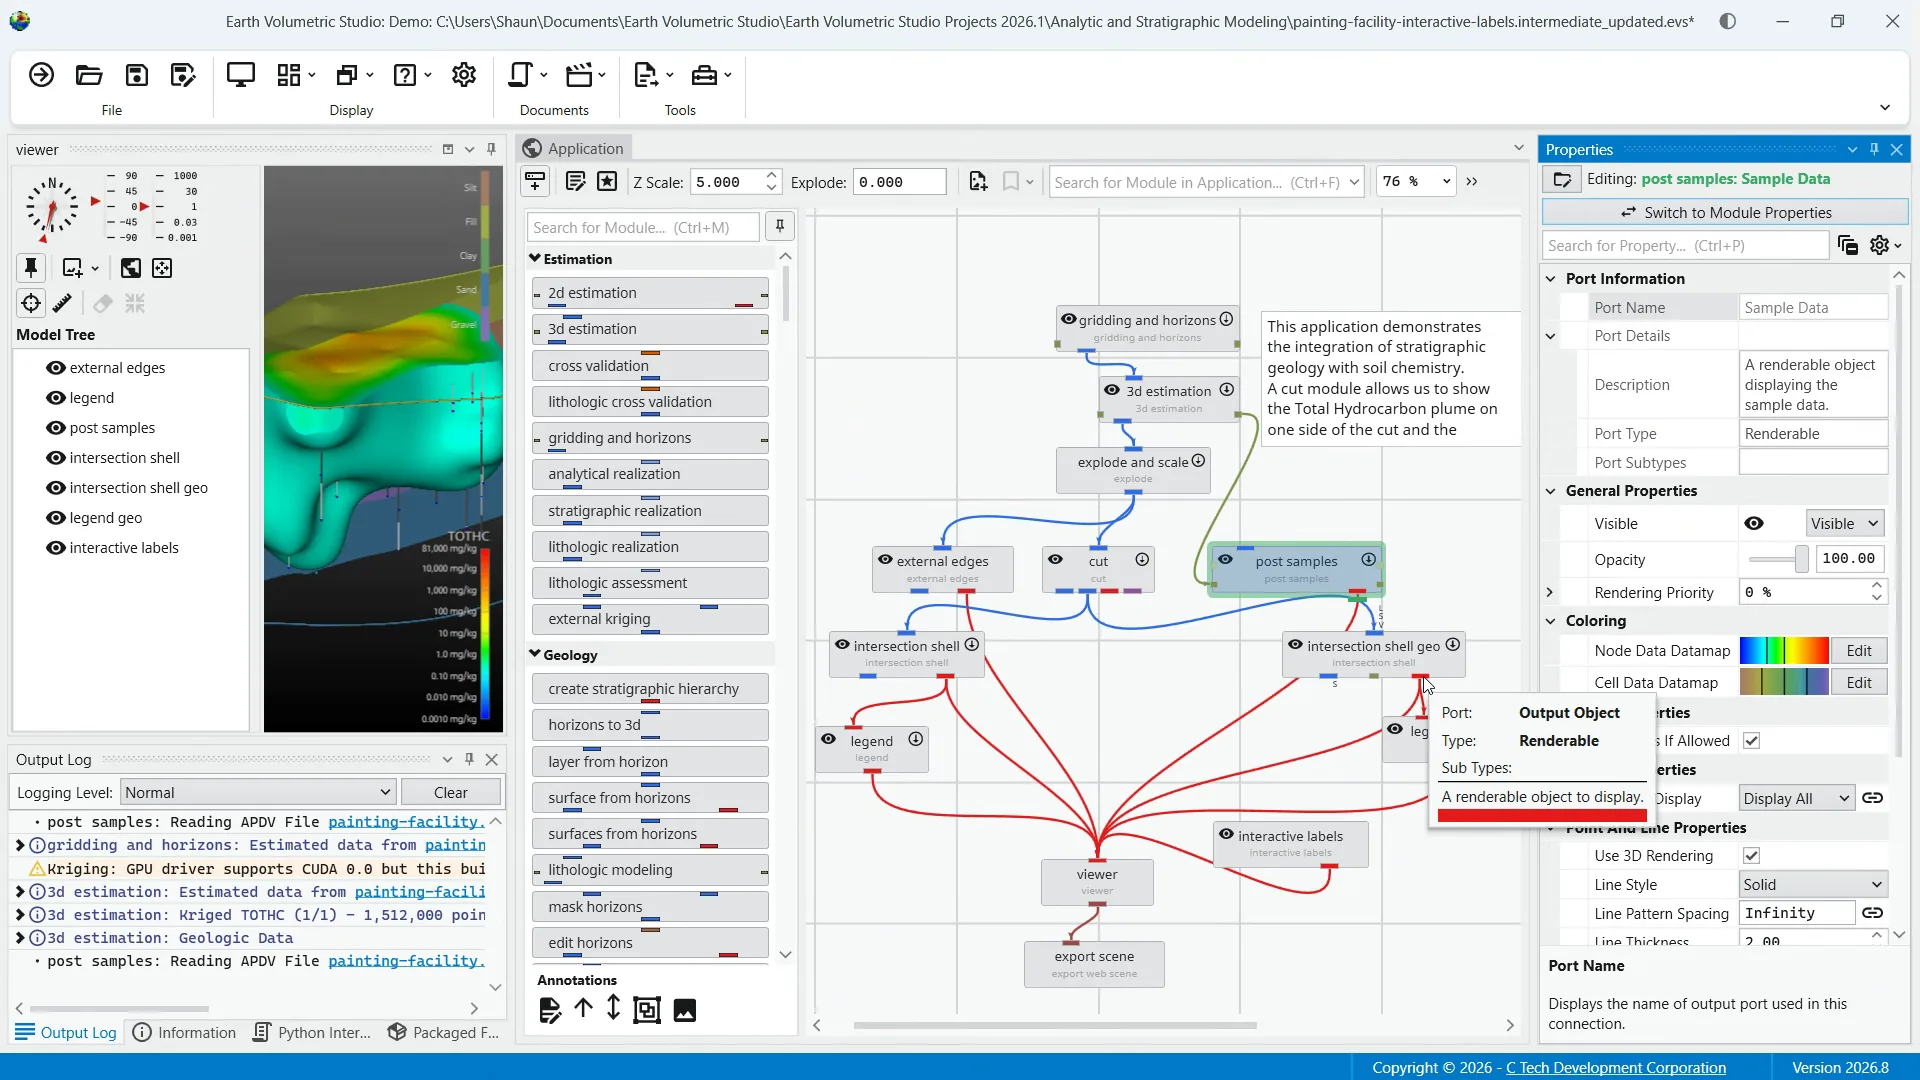
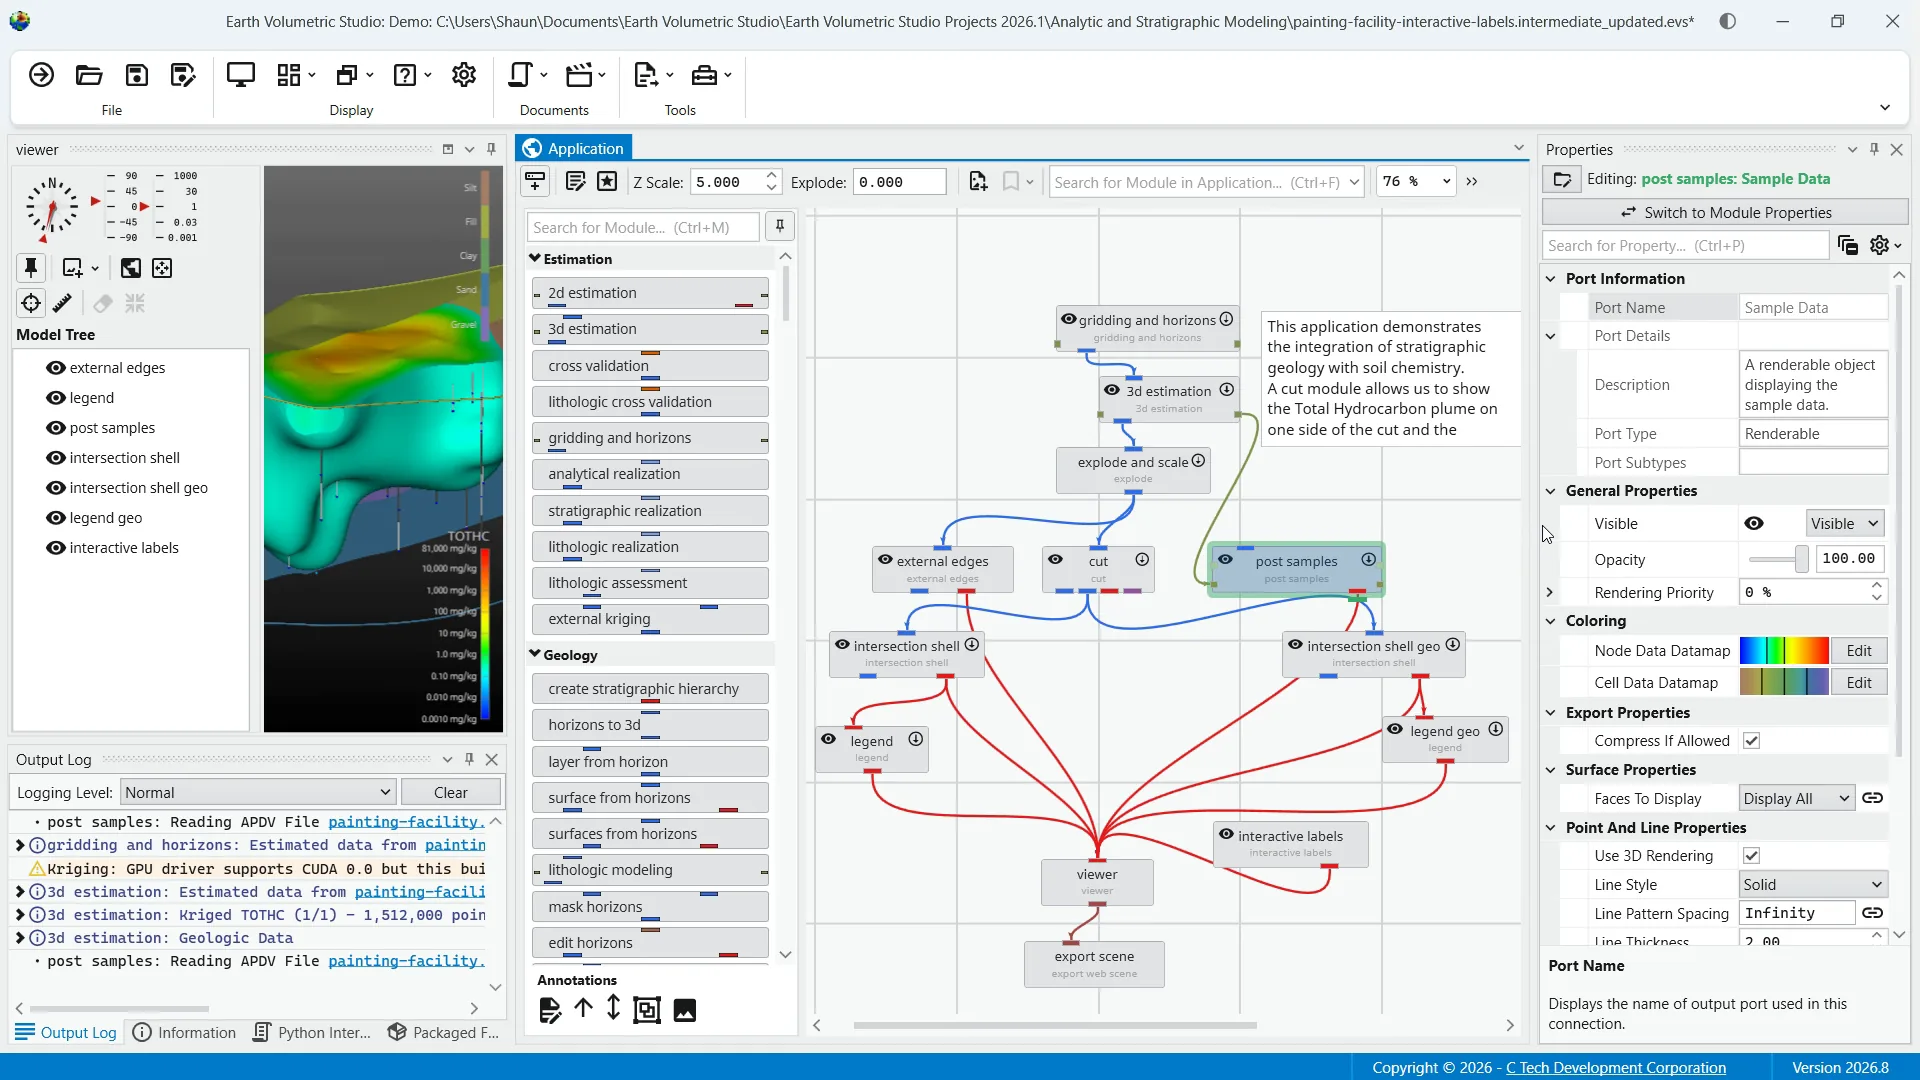
The other window we'll cover is port properties. This can be accessed by double-clicking on an output port within any module or from clicking on the switch to display properties button from the module properties. The window displays detailed information and settings for that specific port.
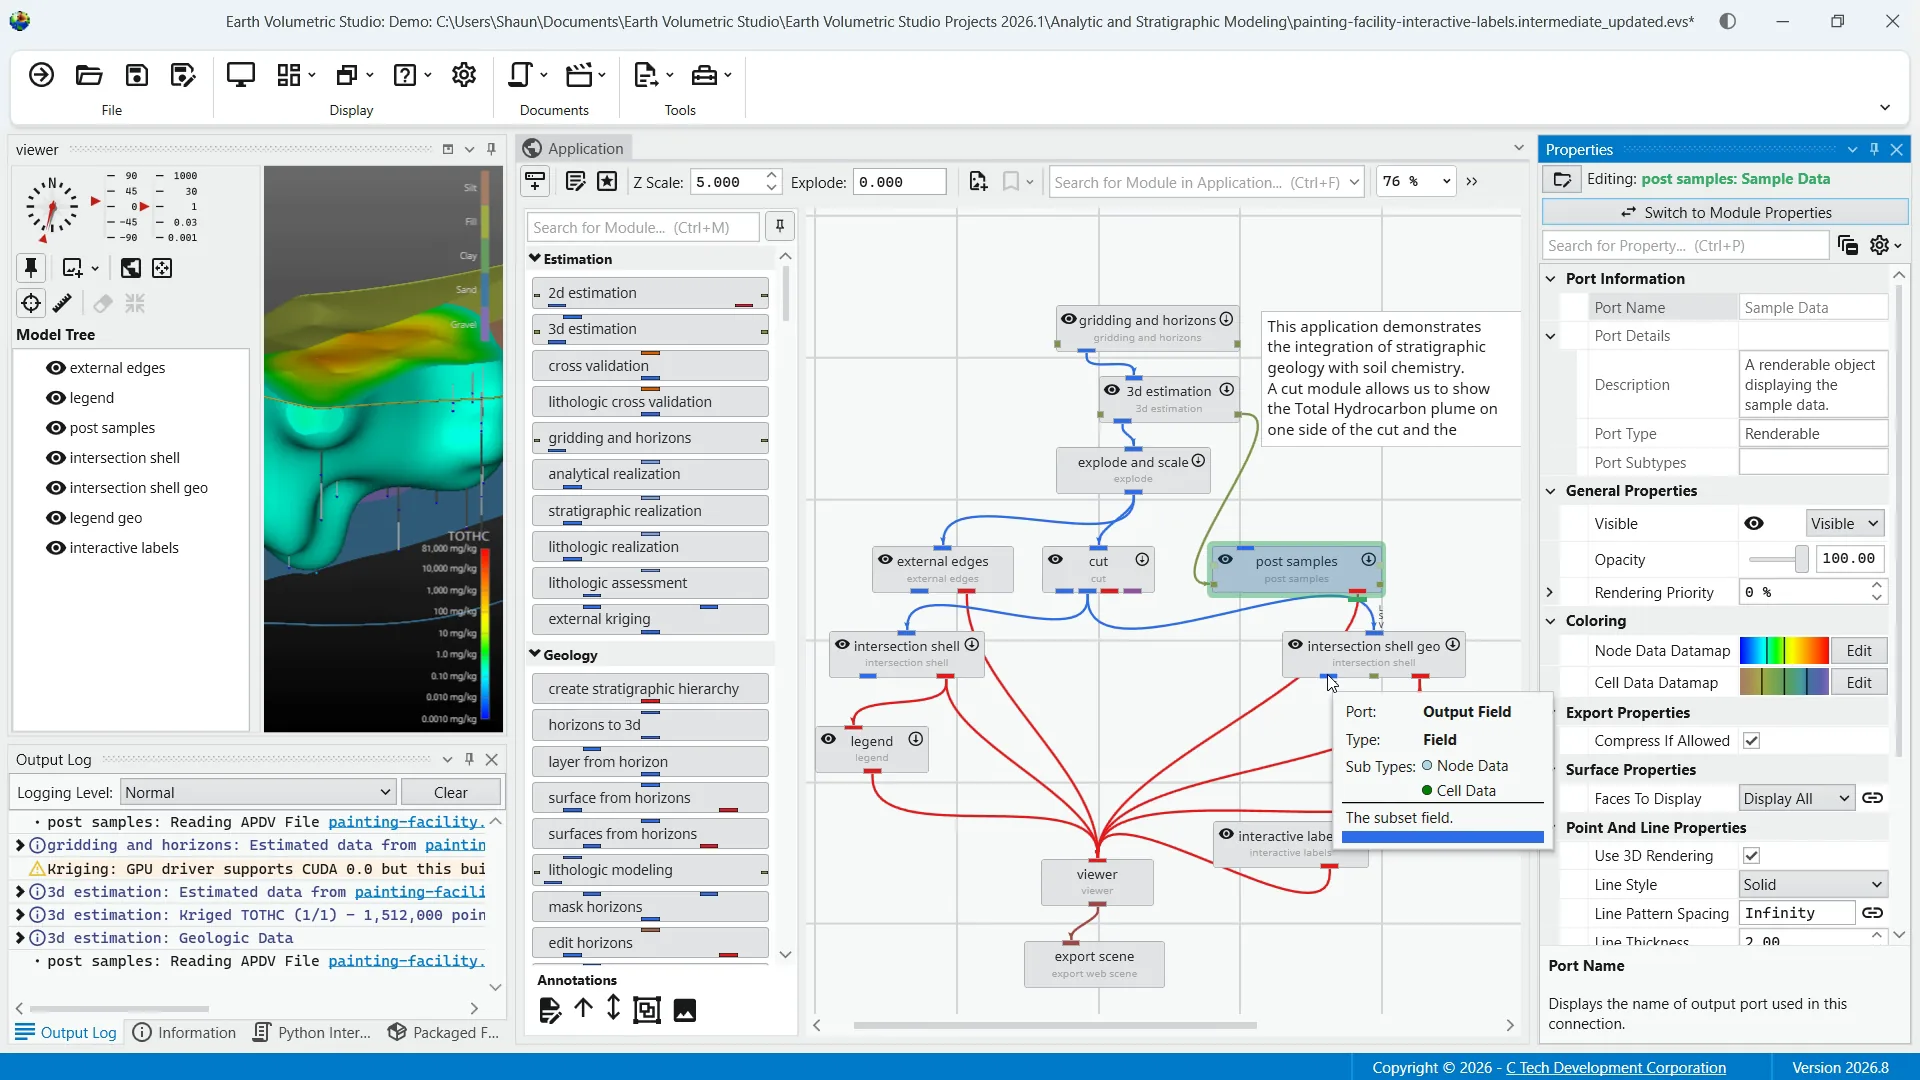
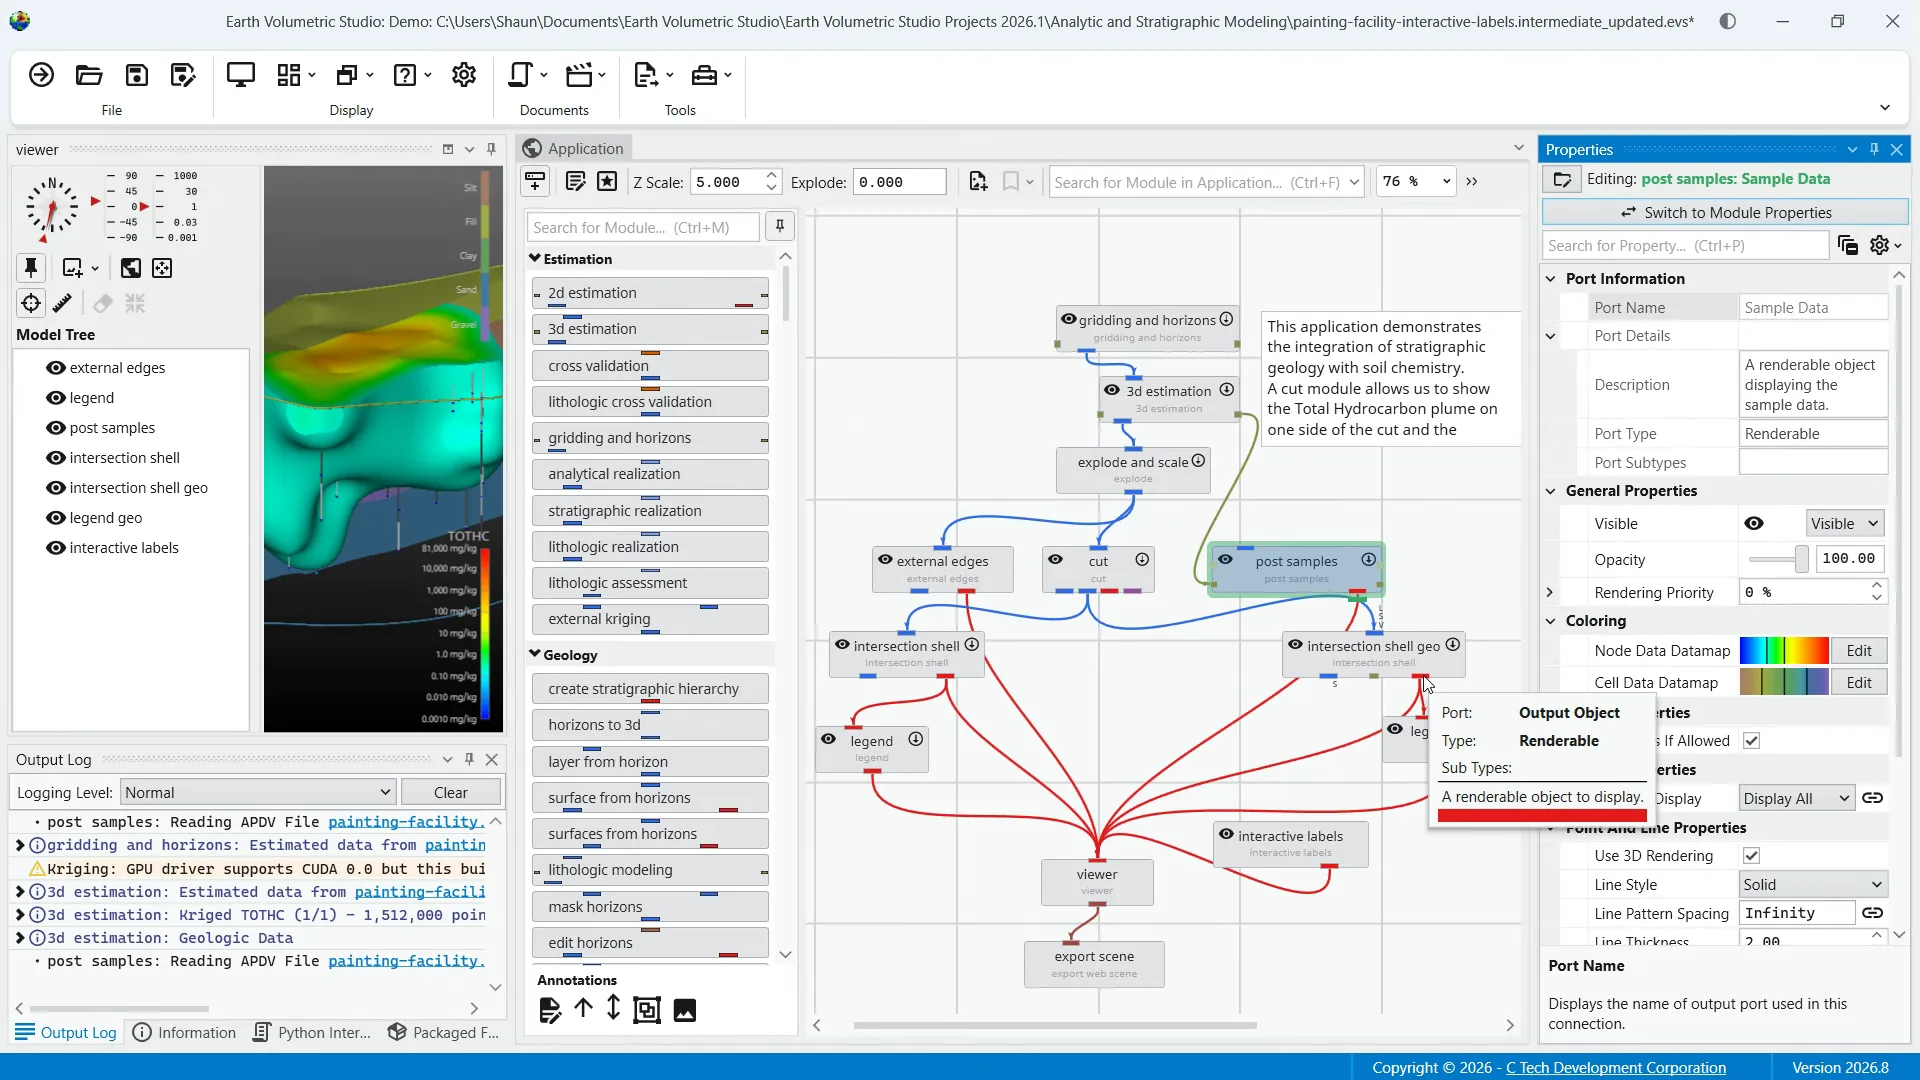
While the properties shown vary depending on the type of data the port provides, there are certain elements that are common to all ports. For example, all output ports display information such as the port name, expandable port detail, as well as your general options and the search feature. Two of the more common port types are renderable object ports displayed in red and field ports shown here in blue.
The renderable object port outputs a visual object such as a surface, set of points, or a volume that can be displayed in the viewer window.
A full breakdown of the many properties of this port type can be found in the help documentation.
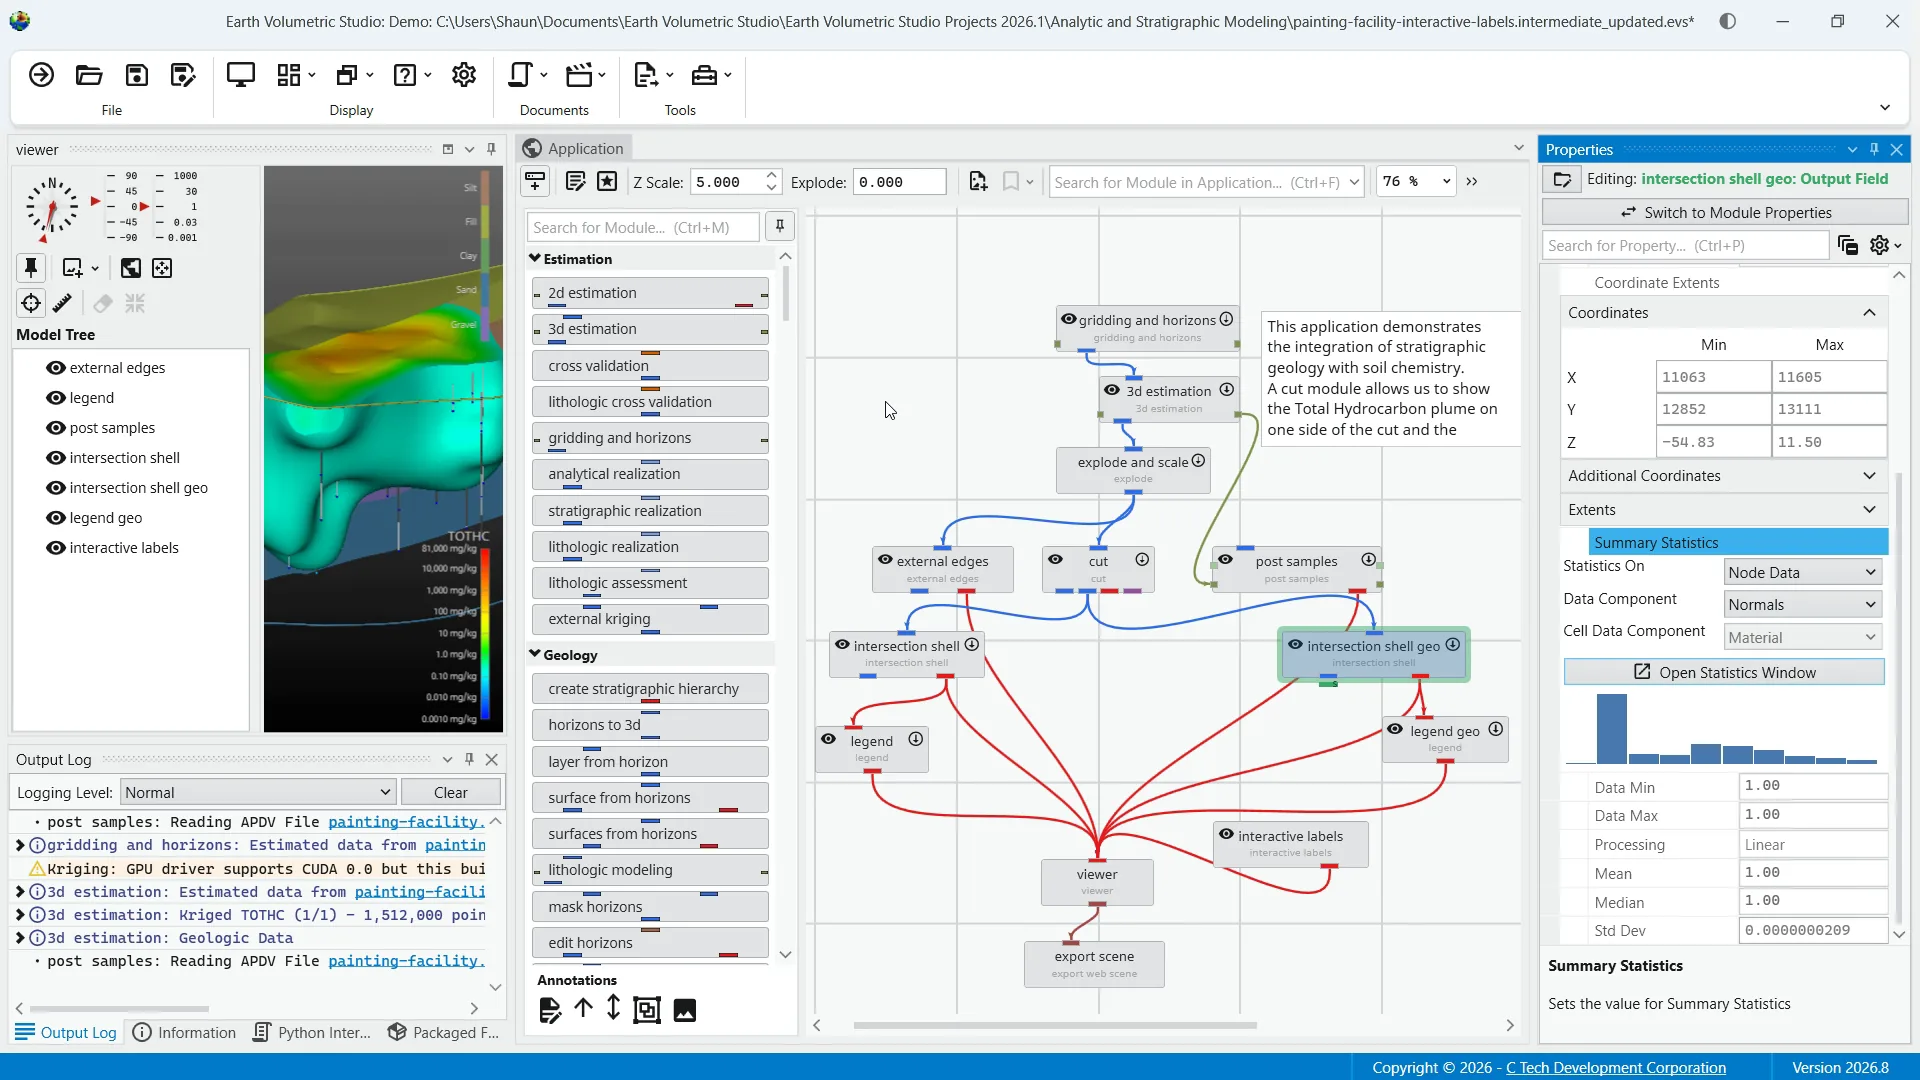
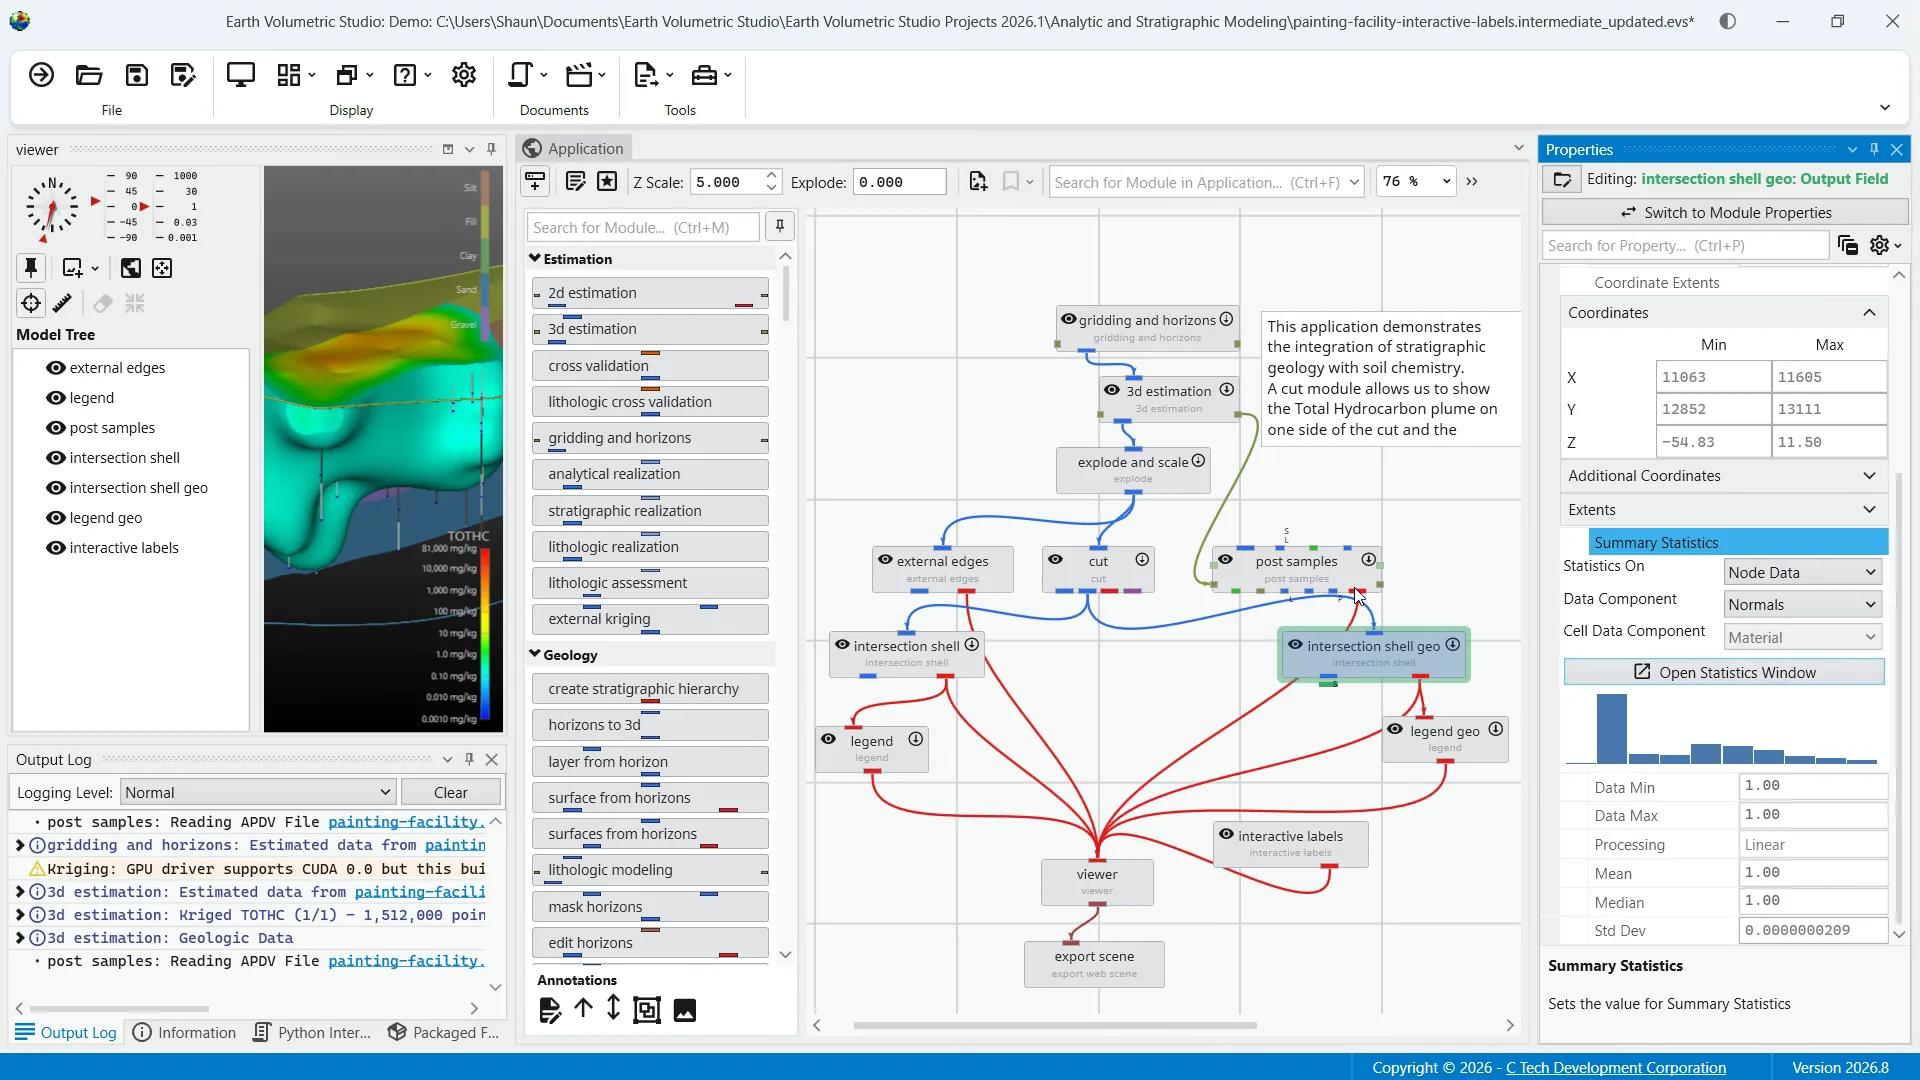
The blue field port is the most common port type and is responsible for passing grid structures and their associated data between modules. Field ports have a wide range of capabilities where you can configure statistics and coordinates as well as utilize a statistics window to provide a comprehensive and interactive environment for analyzing the data within a field. Again, a full range of details on the properties for field ports can be found in the help documentation.
Lastly, we'll quickly go over the datamap editor.
For reference, a datamap is a fundamental concept that serves as the bridge between raw numerical data and its visual representation. In EVS, the datamap editor is the primary tool to communicate the meaning of your data within a visual context. It allows you to create and customize the mapping between your data values and the colors used to represent them by controlling color gradients.
You can also manipulate data ranges and scaling to highlight features of interest in your data represented in a visualization. To access this powerful interface, click the edit button next to the node datamap or cell datamap in the renderable object ports properties window.
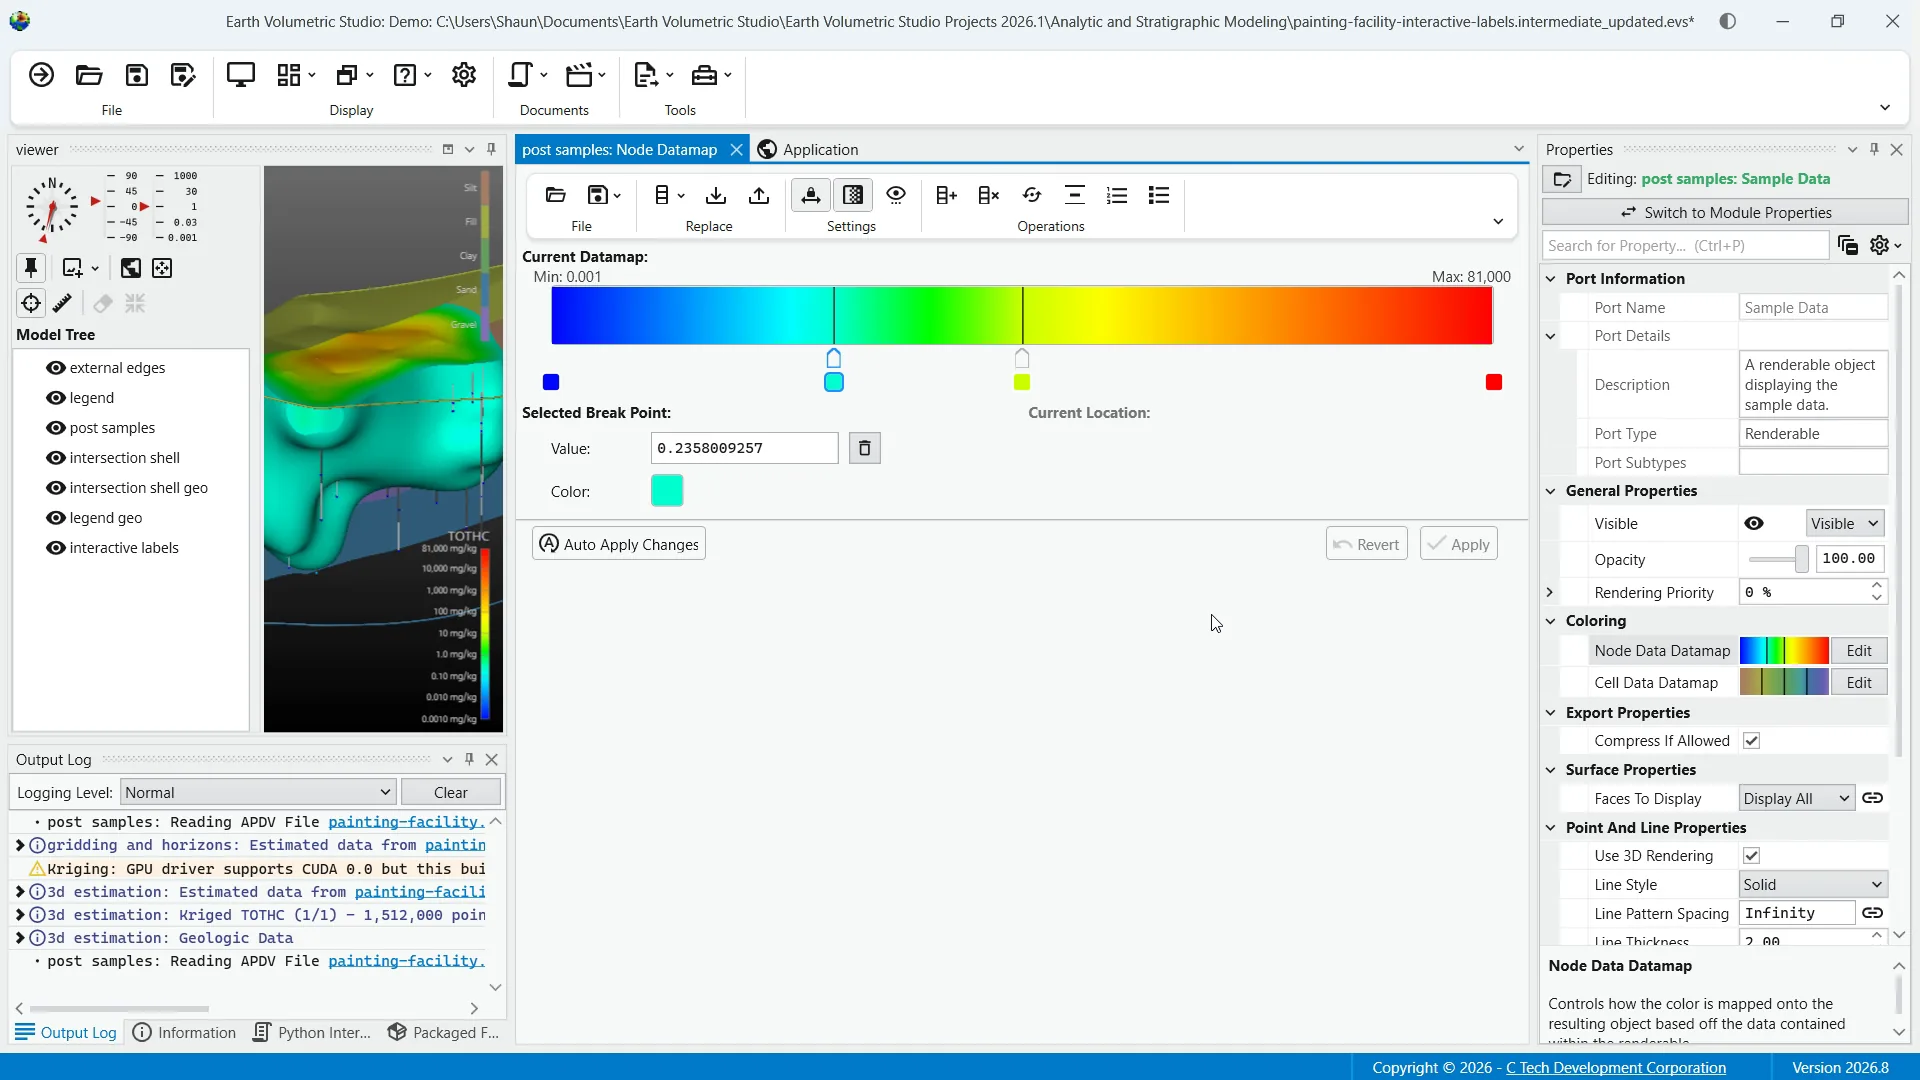
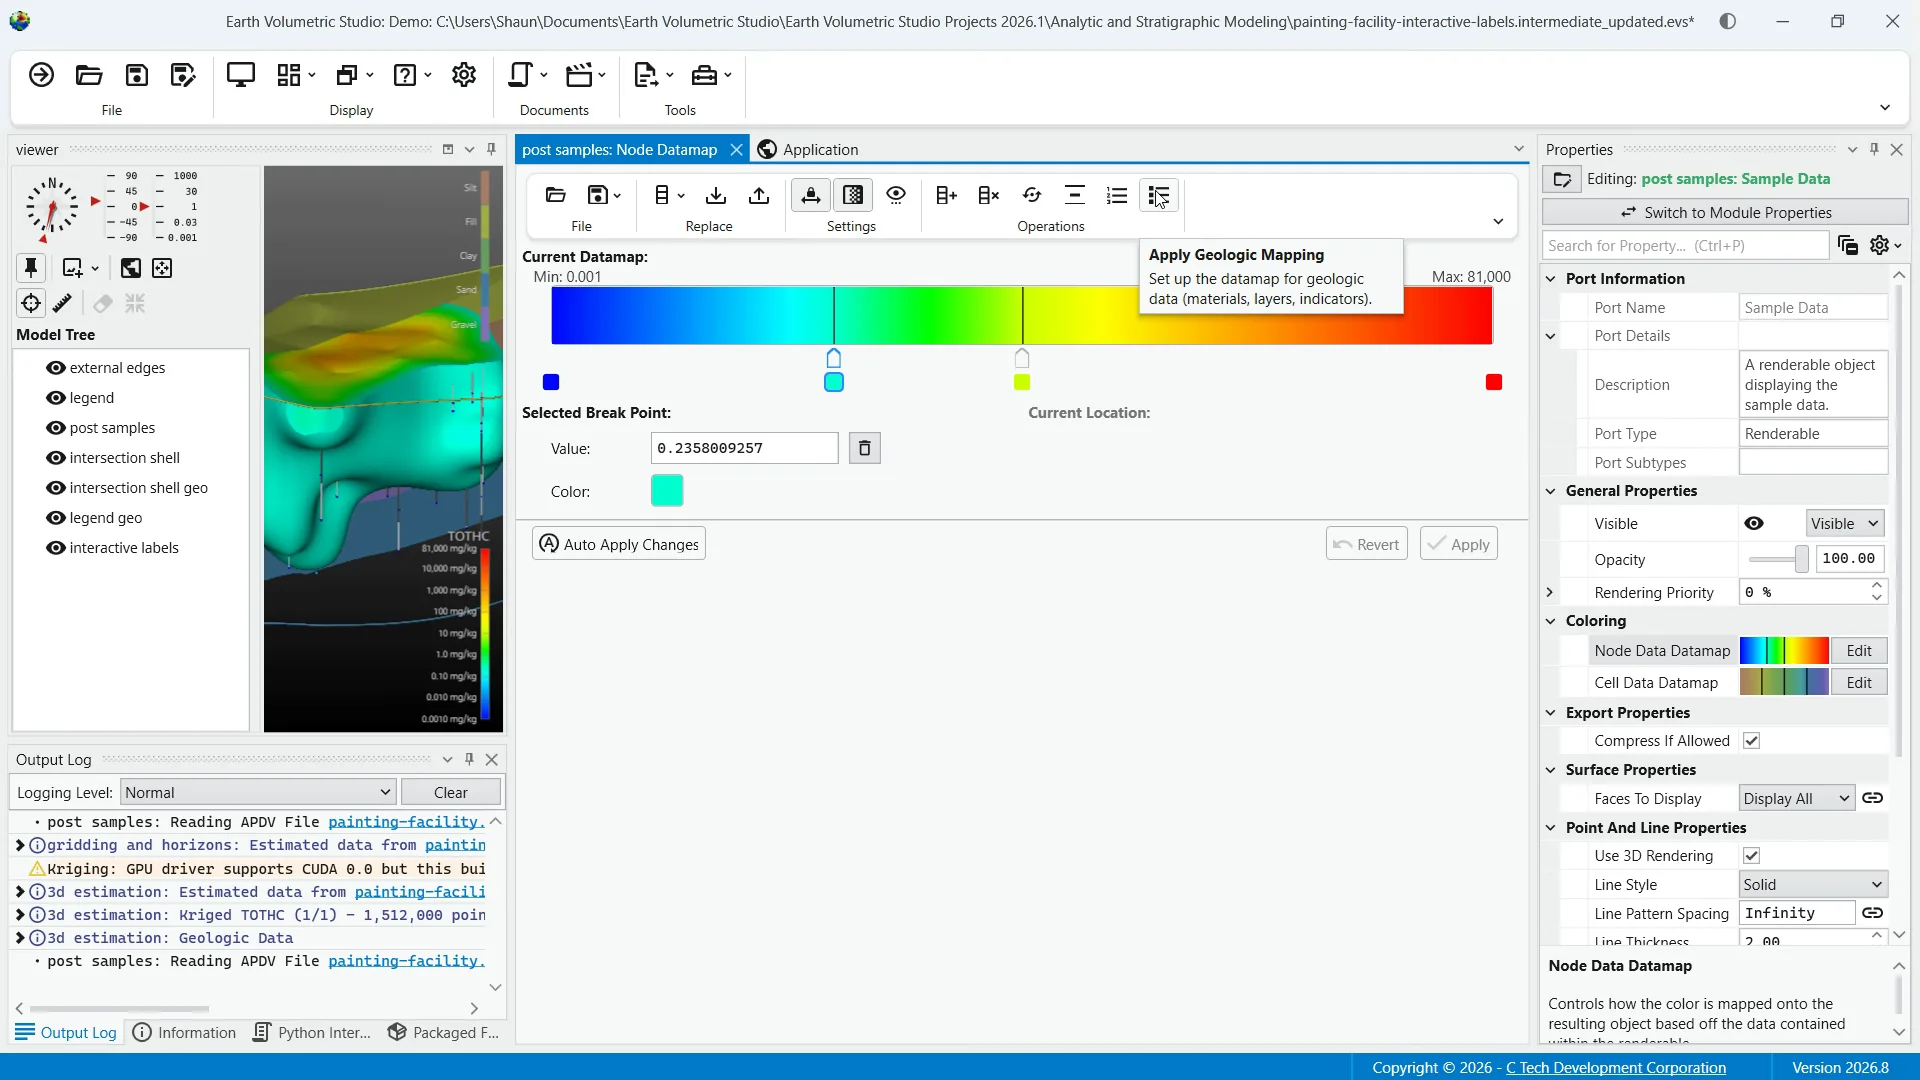
The editor will be presented with a toolbar at the top, a color ramp preview in the middle, and a color break editor at the bottom.
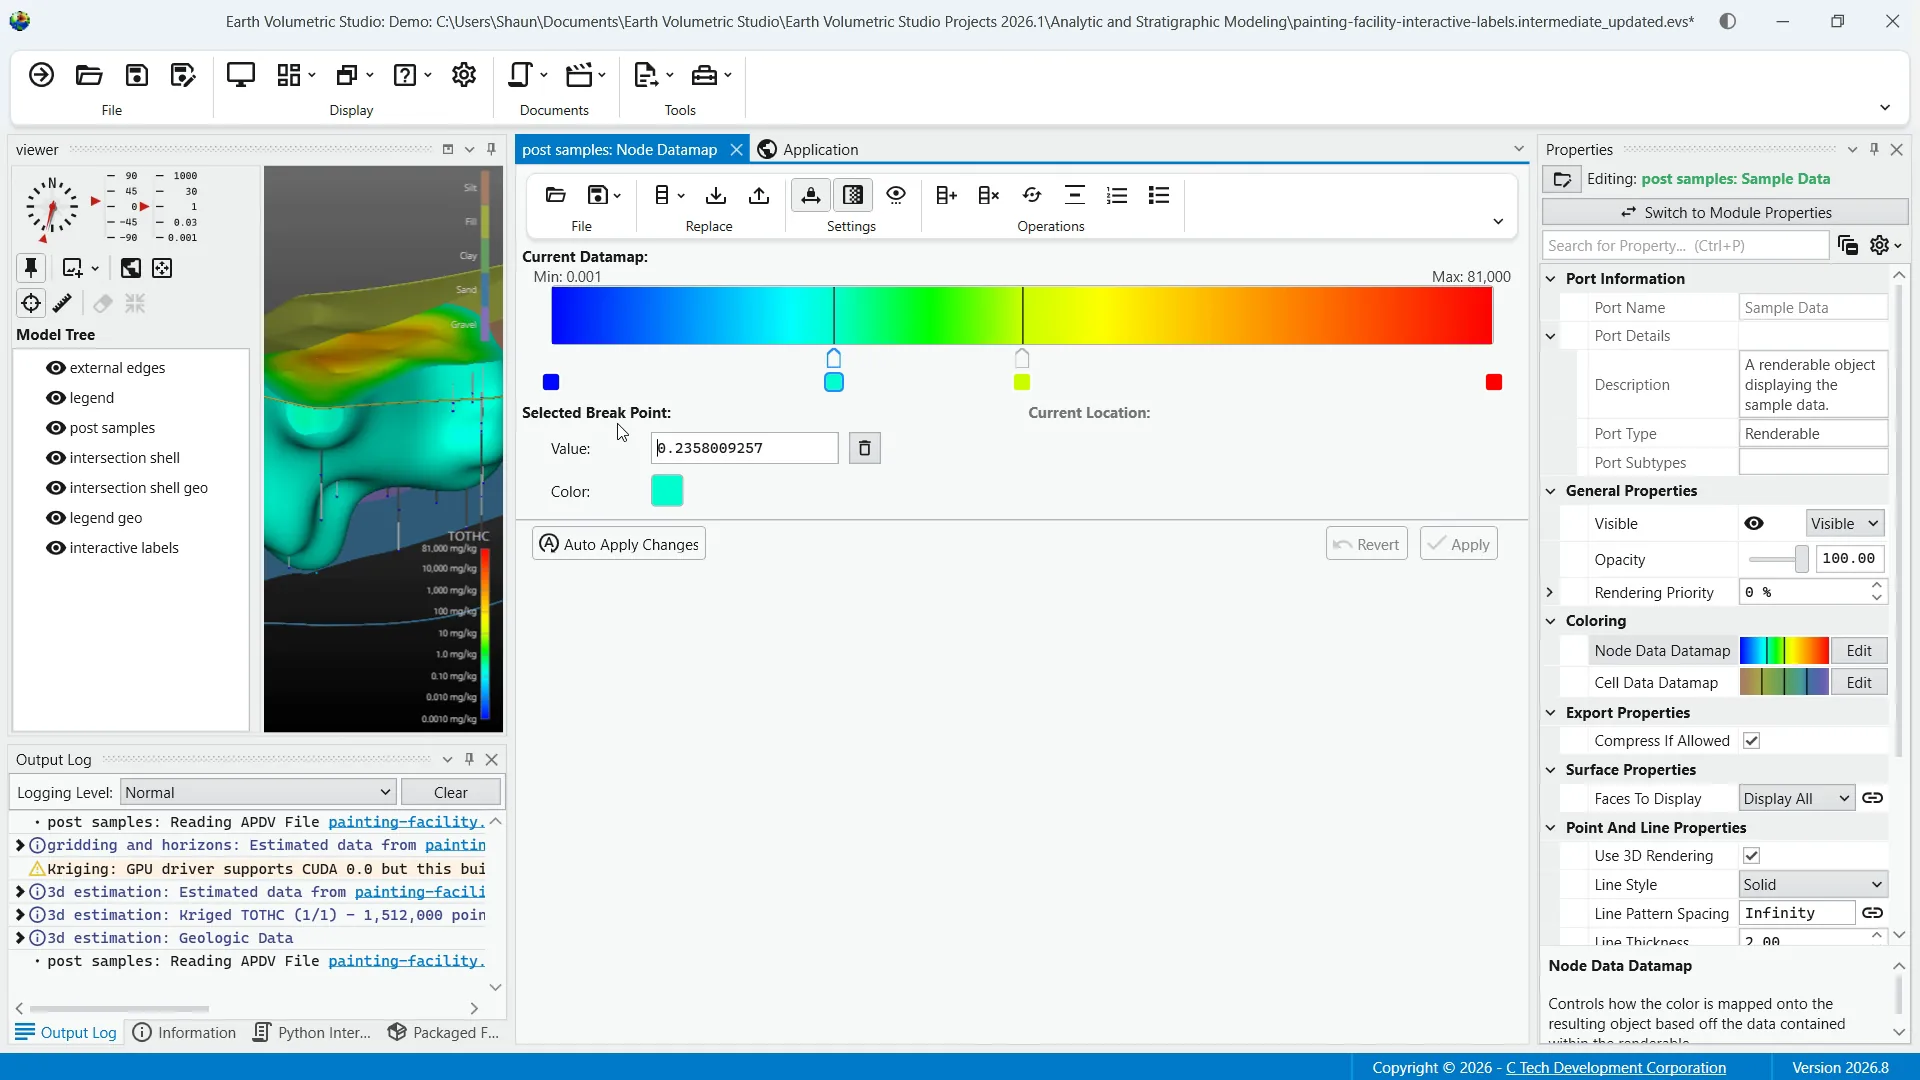
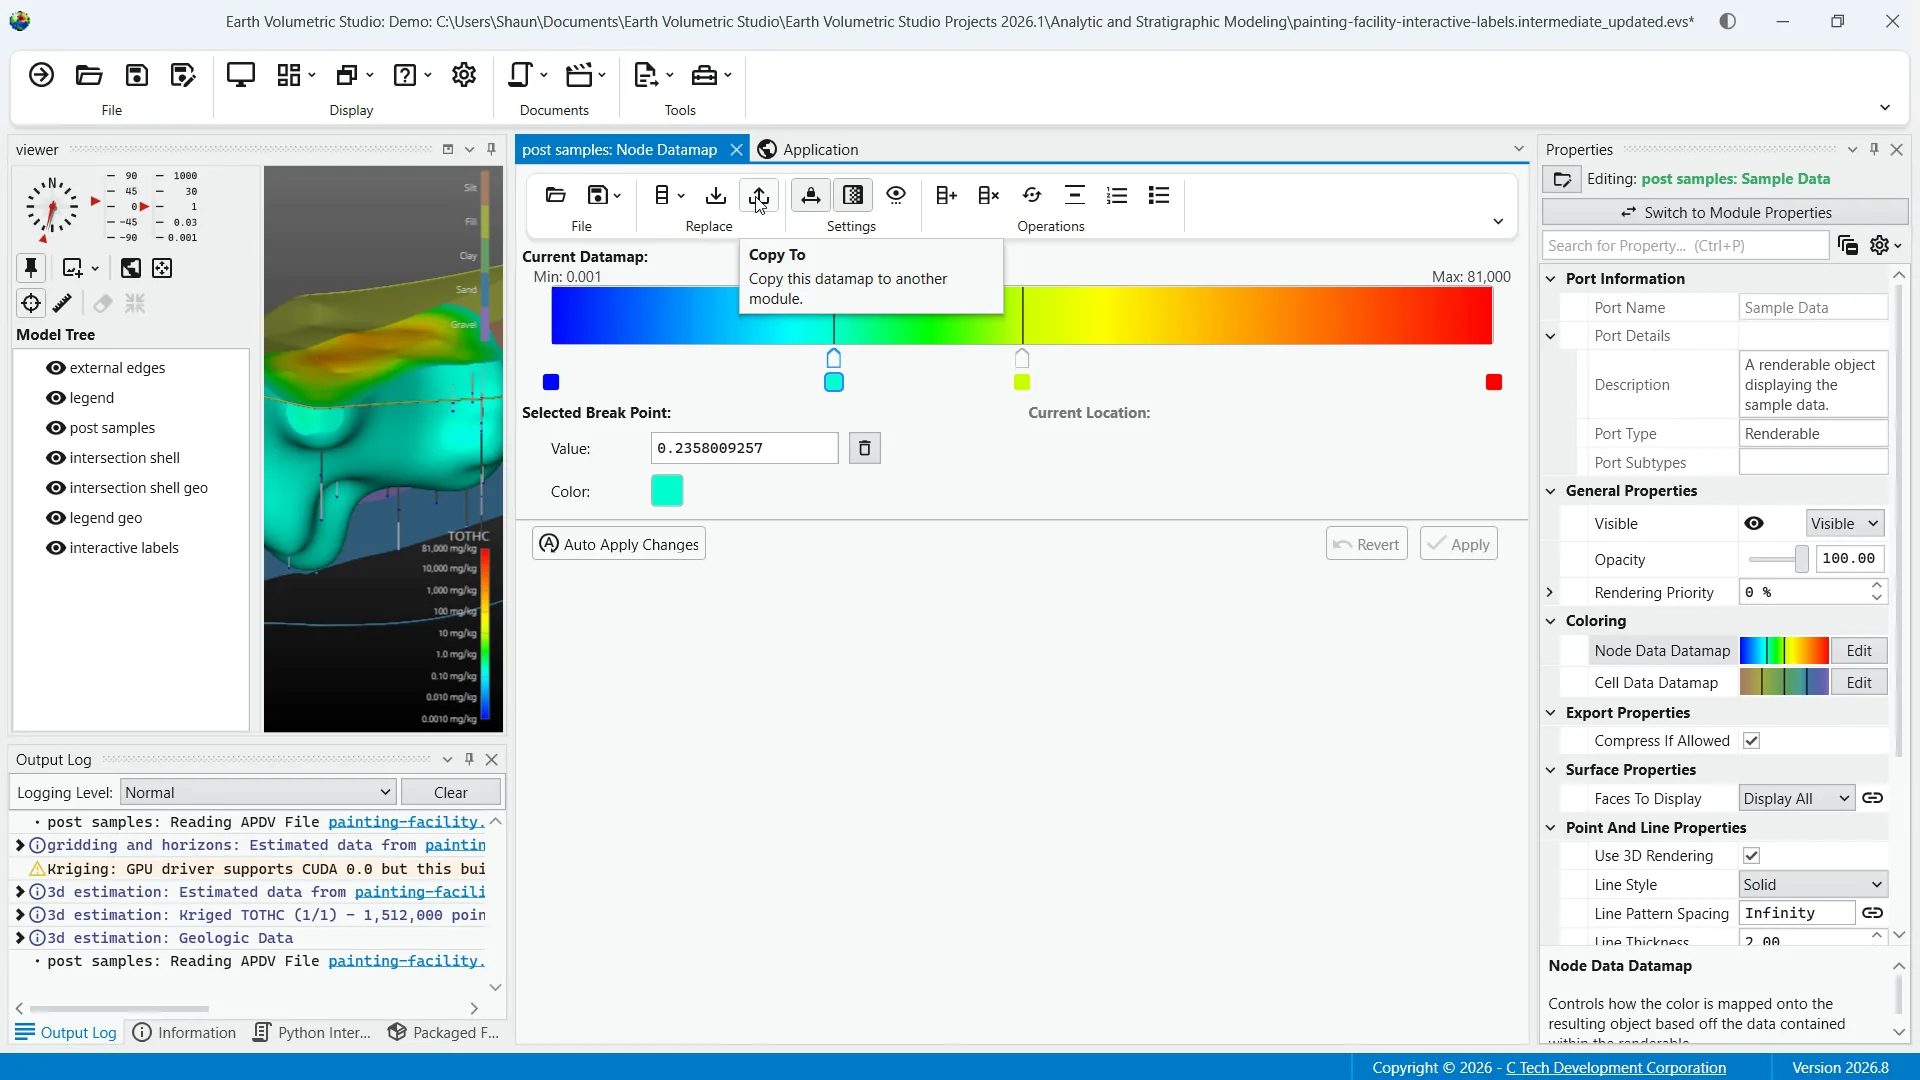
In the toolbar, you'll see operations such as opening a previously saved datamap, save options, and using a template to apply a default datamap template. Next, we have "copy from" and "copy to" functions to move a datamap to or from another module.
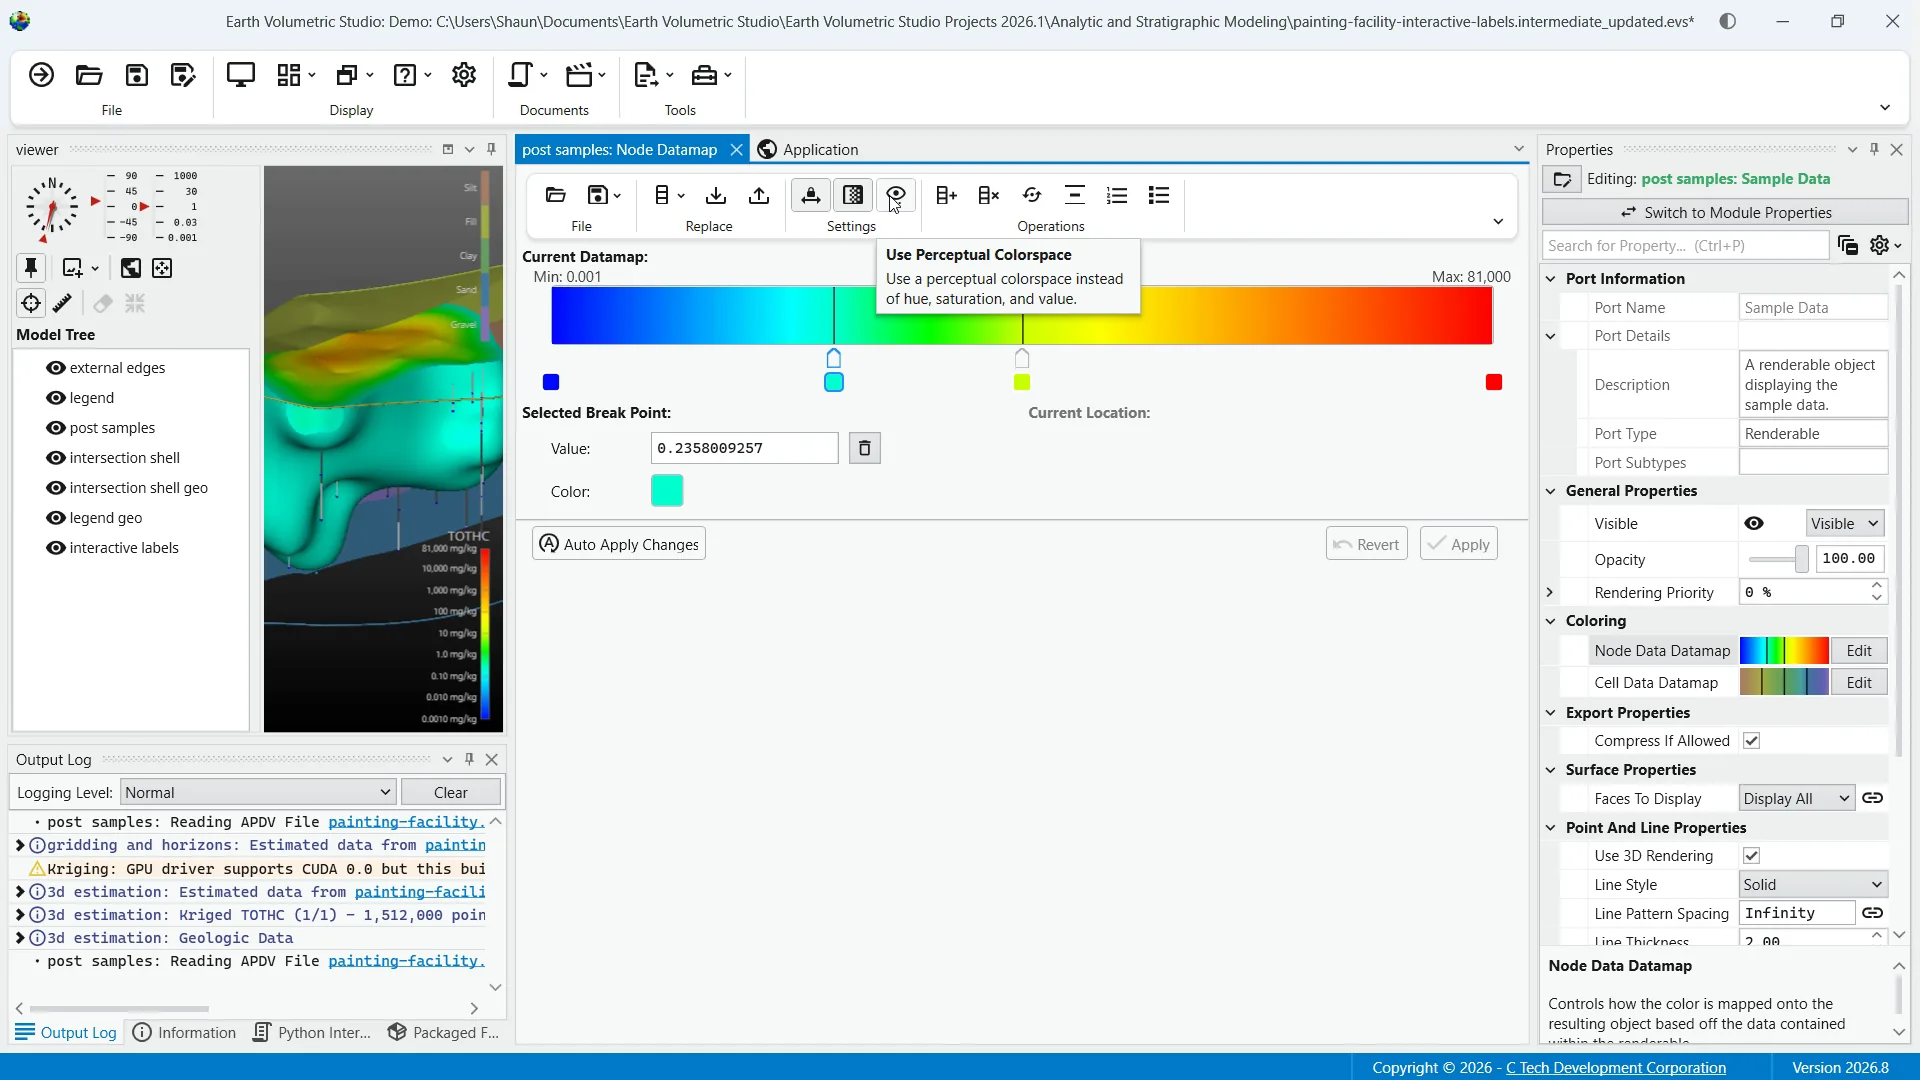
Settings include lock adjacent breaks to lock the colors between breaks, gradient color ranges to control the use of smoothly changing colors, and "use perceptual color space" to switch the color interpolation method, which can produce gradients that are perceived as more uniform and natural to the human eye.
Within the operations tools, you can add breaks, clear breaks, flip ranges, which reverses the color ramp, evenly space breaks, create breaks from bands, and apply geographic mapping.
This last option is designed for categorical data, creating a series of discrete solid color ranges corresponding to the integer IDs used to represent different geologic materials.
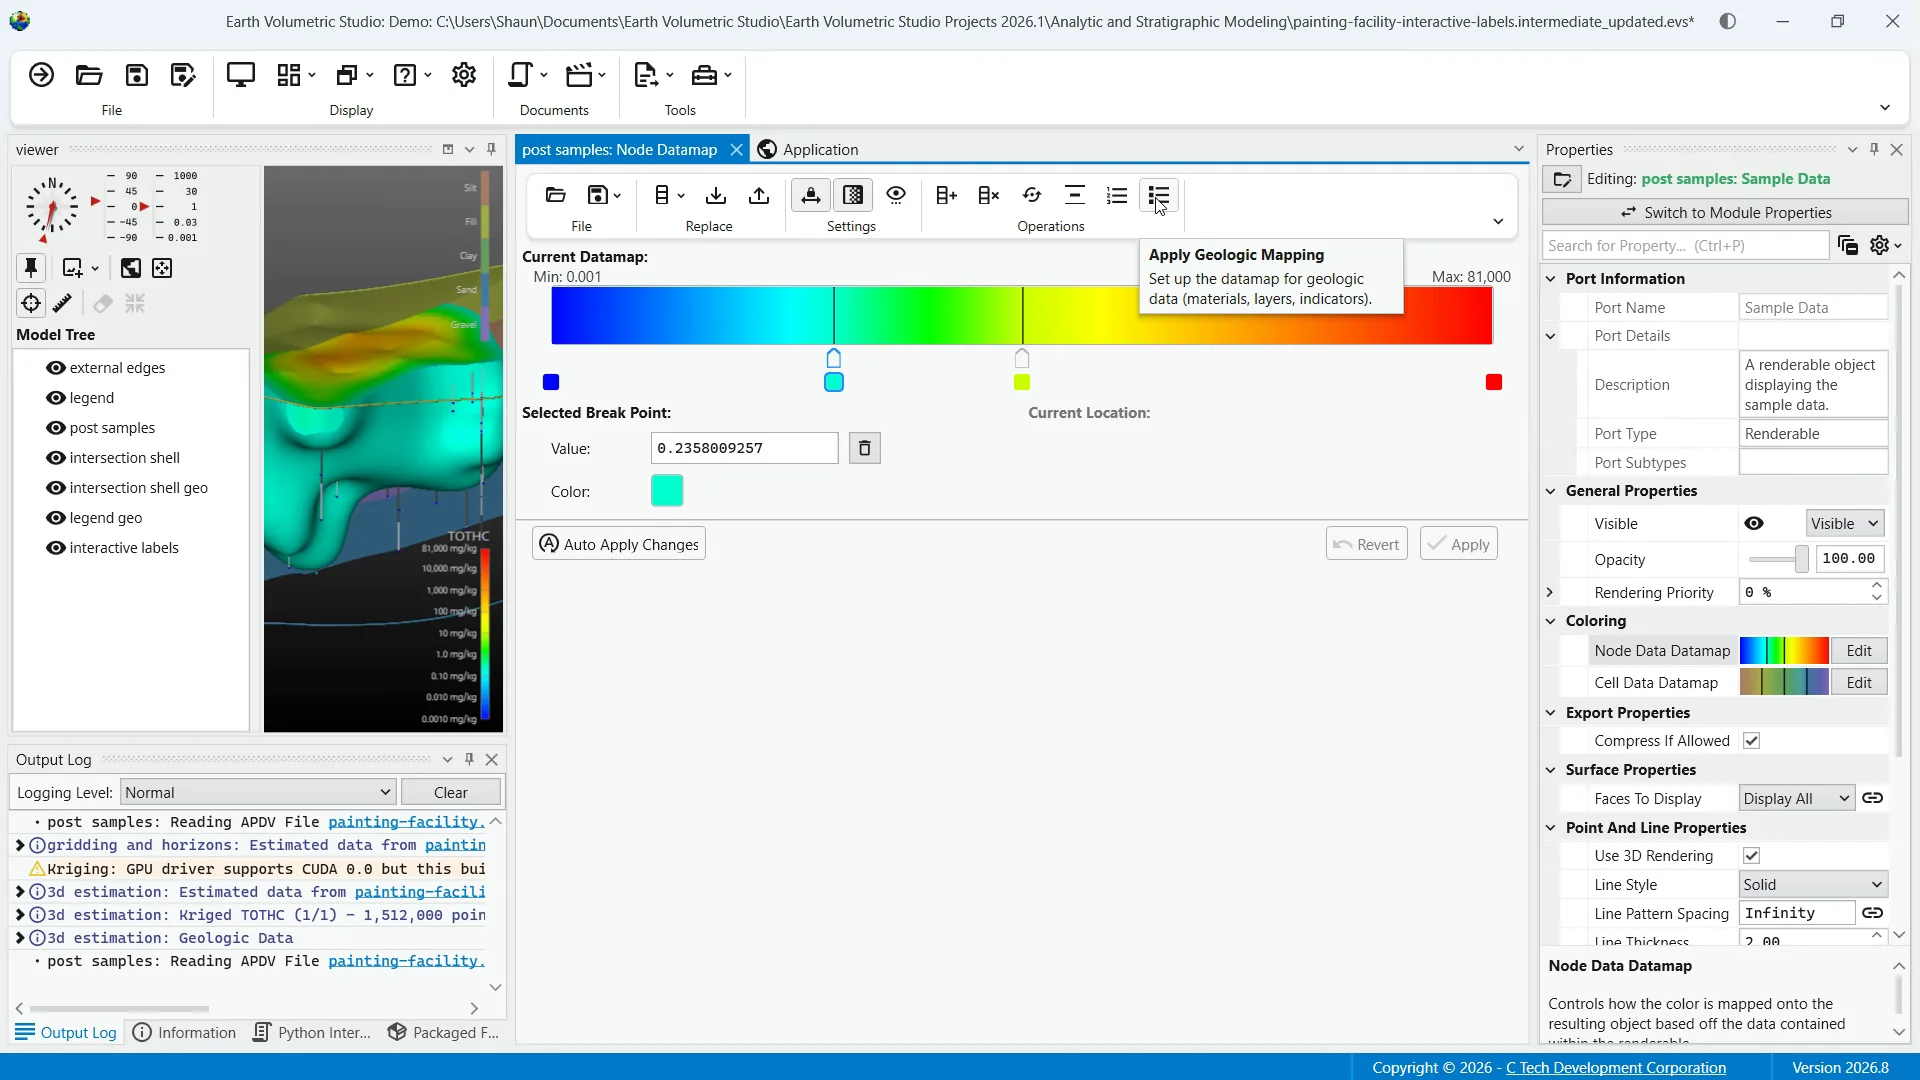
Lastly, the color ramp and break editor is the main interactive part of the editor where you can define the datamap. The first thing you'll notice is the color ramp preview. This displays the colors and the smooth transitions between them based on the color breaks you have defined below it.
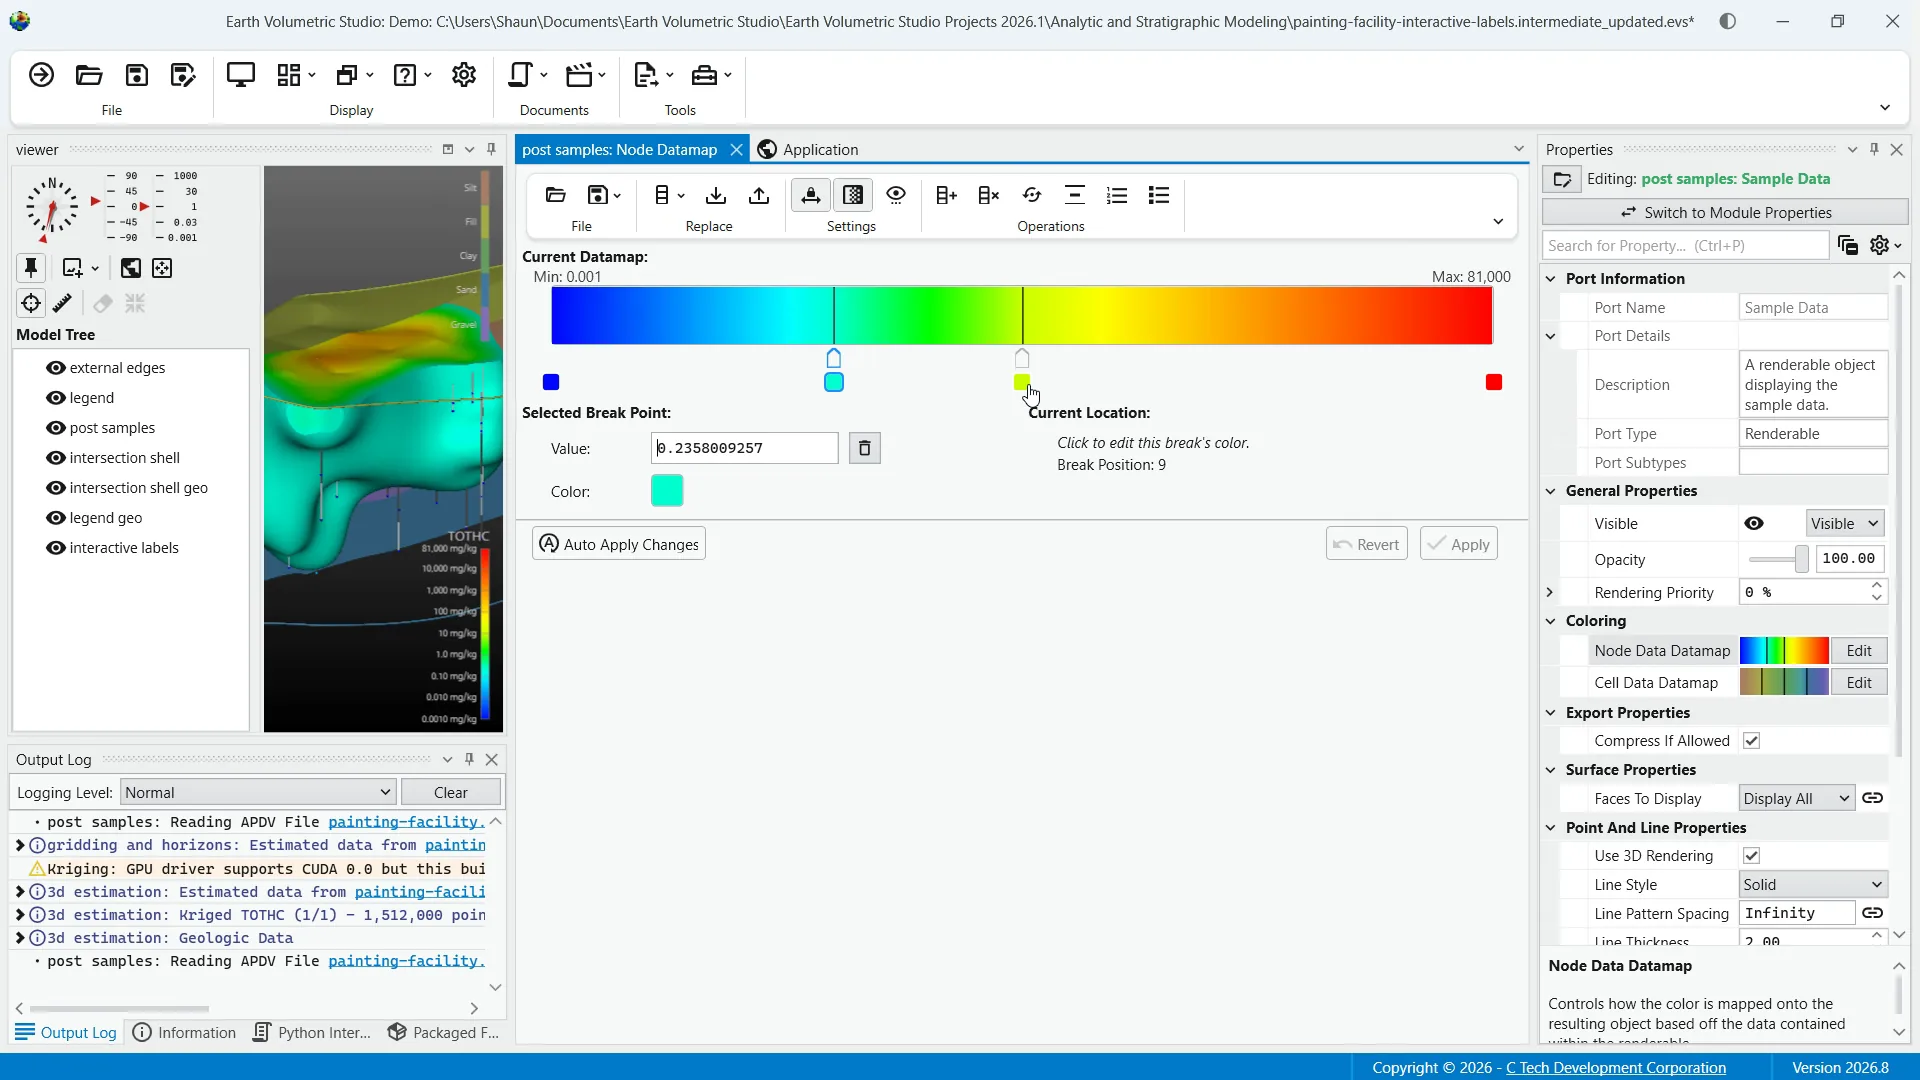
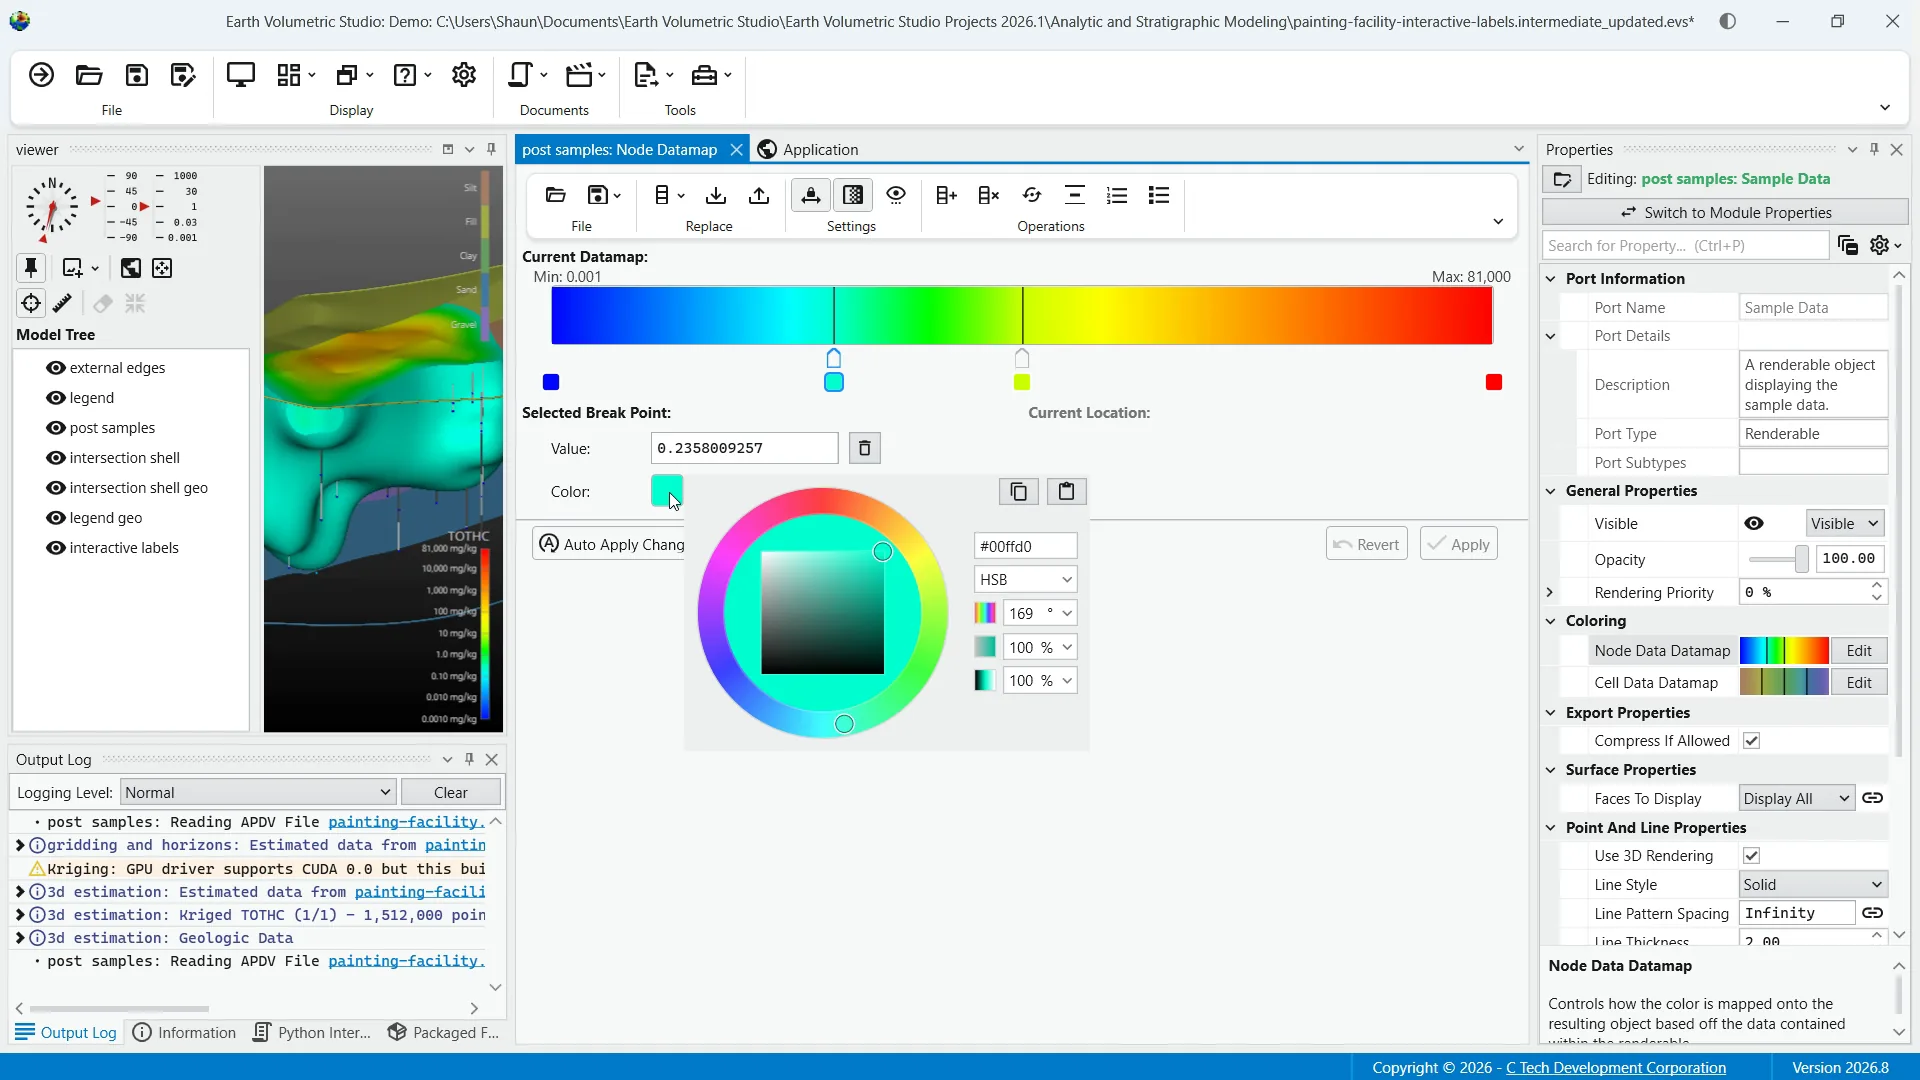
The color break editor is the section where you define the specific points of your datamap using one or more color intervals and the points that define the intervals at the color breaks. Each color break is represented in the editor, which includes a data value input box for a precise numeric entry, and a color swatch to set the color of the break.
And that is an overview of the properties window in the EVS environment. Thank you for watching.
This tutorial provided a comprehensive overview of the Properties window in Earth Volumetric Studio, covering how to access and manage object properties with configuration options, and utilize the datamap editor. By following these steps, you can efficiently customize and control your application's parameters and visualizations.
Introduction
In this tutorial, you will learn how to use the Properties window in Earth Volumetric Studio to view and edit parameters of various objects. This guide covers key features and tools to help you manage your application settings effectively.
1Overview
In this demonstration, we will be looking at the Properties window as a primary interface to control objects in your application.
2Open Properties Window
This includes editing options for modules, ports, or the application itself. If not already open, the way to access the properties window is from the Windows button on the main toolbar.
3Selecting the Object
When you have the window visible, you can load objects properties for editing. The most direct way to do this is to double click on the module or port you would like to see the properties window for.
4The Search Window
The properties window has several useful tools to help manage your parameters, such as the "search for property" box to filter displayed properties by searching a text string. You can also collapse and expand categories by clicking on the collapse button.
5Options Menu and Display Toggle
Next to that is your options menu where you can control global settings for the window if you'd like to change how properties are displayed. The switch to display properties button can toggle between the properties of the selected module and that of the output ports of that module.
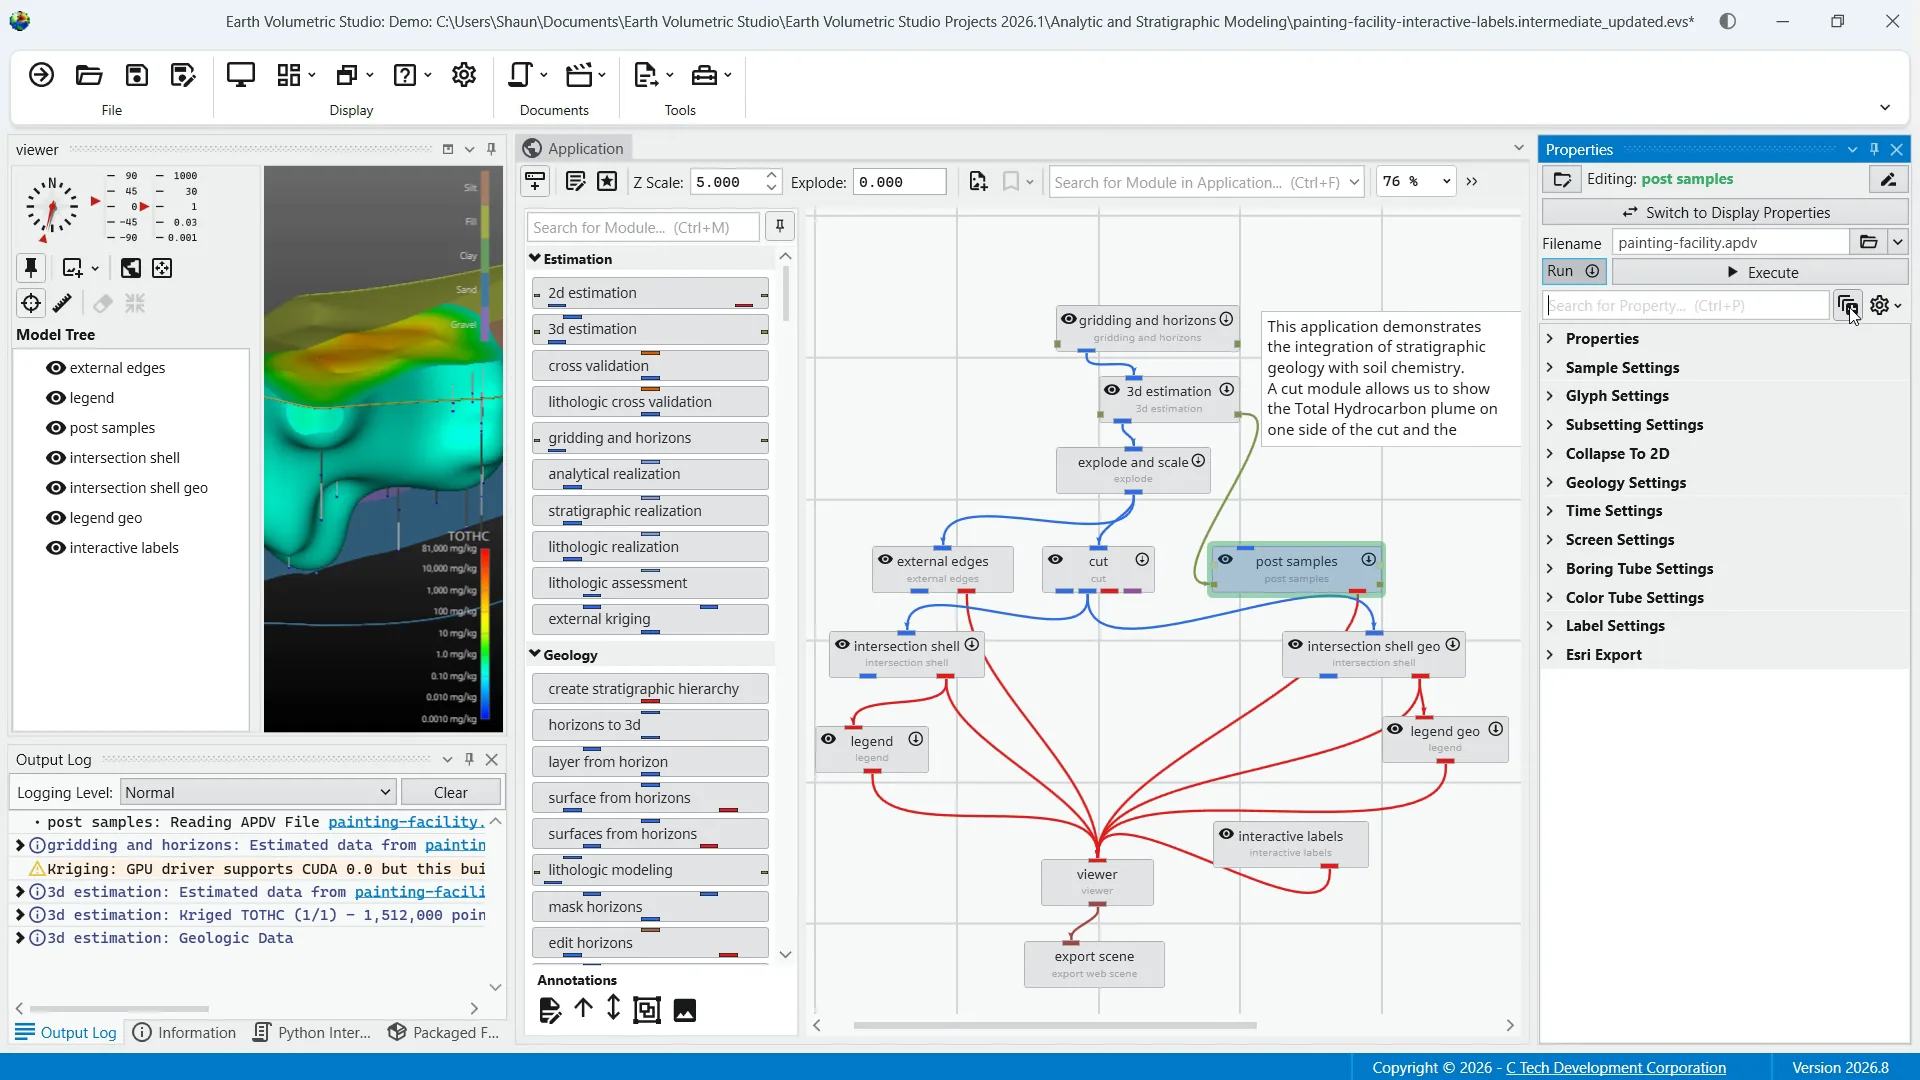
6Switch to Module Properties
This can be a quicker way of managing port and module properties without moving your cursor over to select and double-click each time in the application network. Additionally, the same button switches to application favorites when you are in the application properties window.
7Favorites
Note, you can favorite any property in an application. To favorite a property, click in the empty space to the left of its name. A star icon will appear indicating that the property has been added to your application favorites.
8Property Description Area
Lastly, you'll notice at the bottom of the properties window a description area. This displays a brief explanation of the property you have selected. This can be helpful context when you are making your configurations.
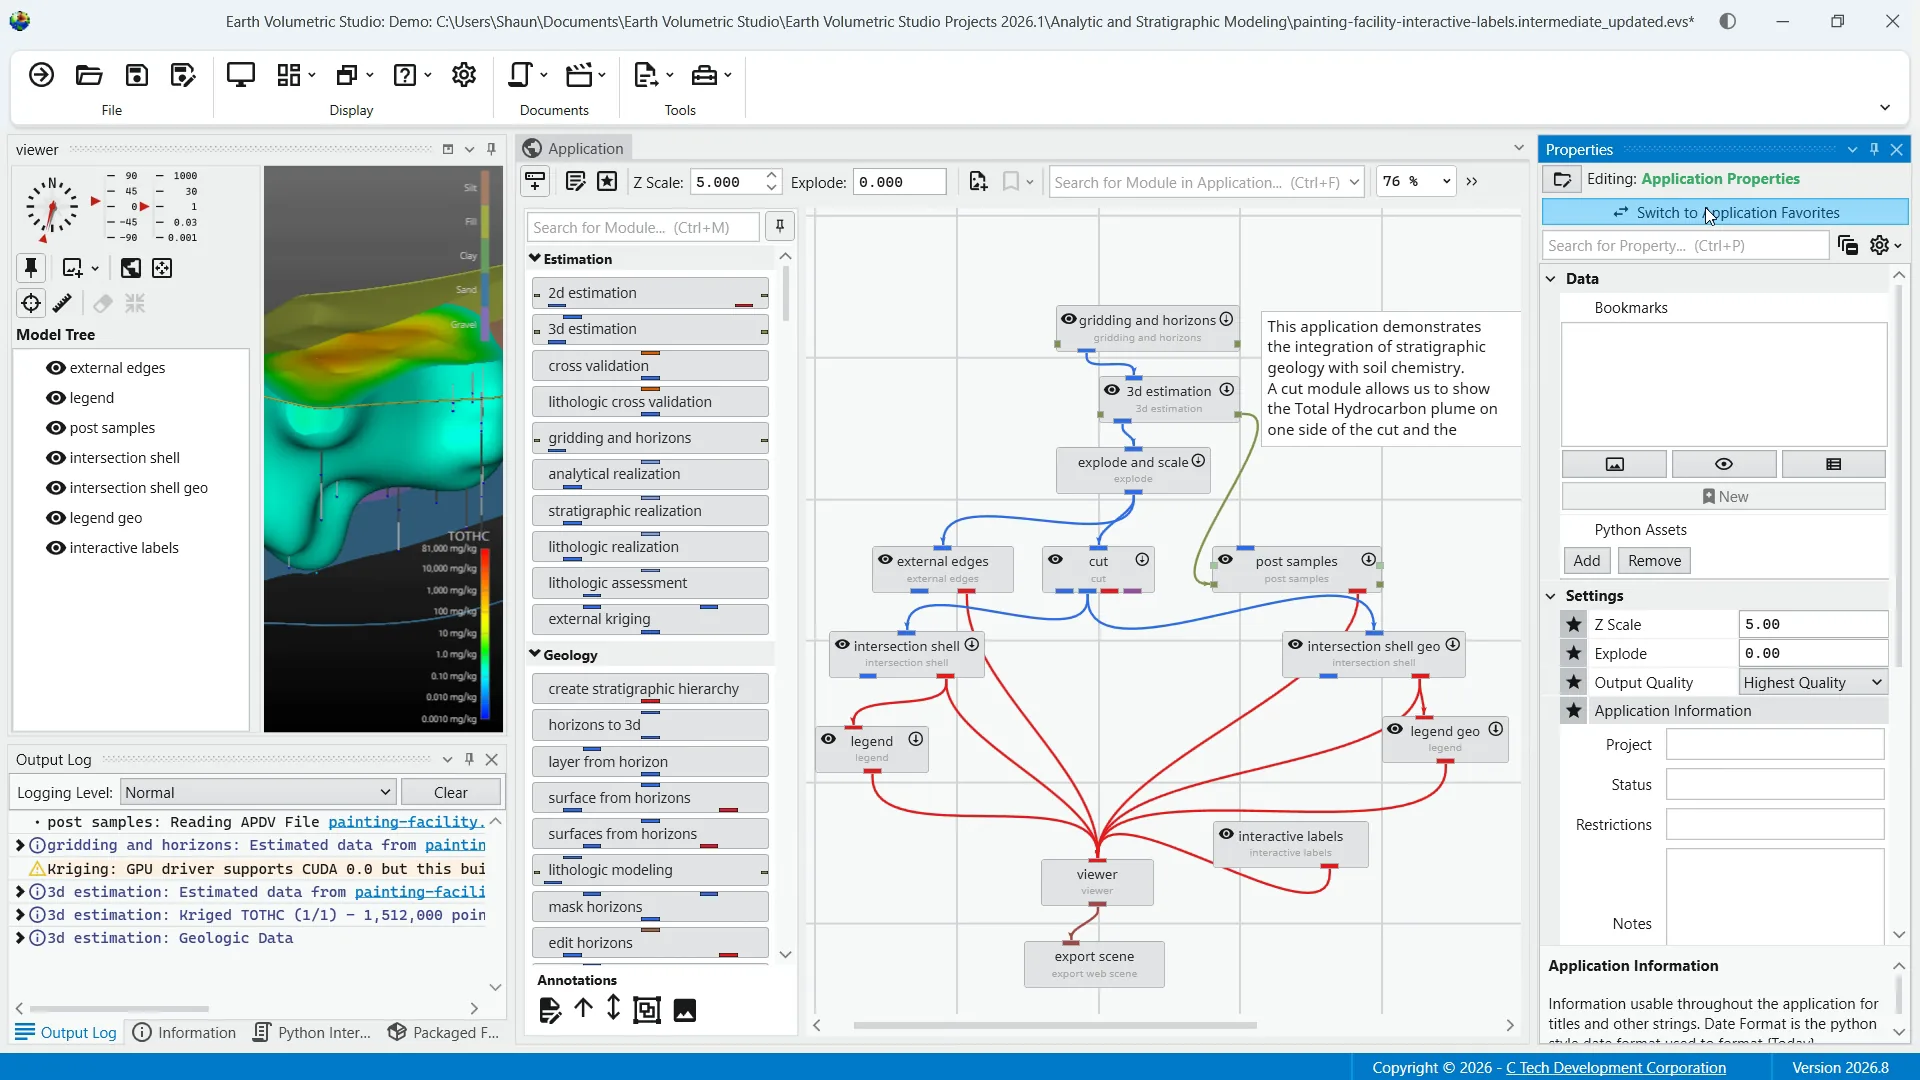
9Access Application Properties
First, we'll look at the properties for the application itself. If you have a module or port selected, you can double-click anywhere on the background in the network area to access the application properties.
10Collapsible Categories and Bookmarks
You'll see each category is collapsible and expandable for viewing preference. Let's quickly overview some of these properties. You have bookmarks at the top to manage or save bookmarks. It is here you can save and recall specific configurations of your application. They act as snapshots that can instantly change views, visibility of objects, and the current state of sequences.
11Export Capability
These bookmarks can also be exported to CTEC web scenes to optimize user experience.
12Python Assets
Beneath that, you have Python assets where you can add Python scripts from other Python files in your application.
13Configurable Parameters
Z scale adjusts the vertical exaggeration of the 3D model. Explode controls the separation of layered data components You have output quality options, application information as a means to supply metadata for outputs and scripts, and application colors to customize the appearance of module outputs.
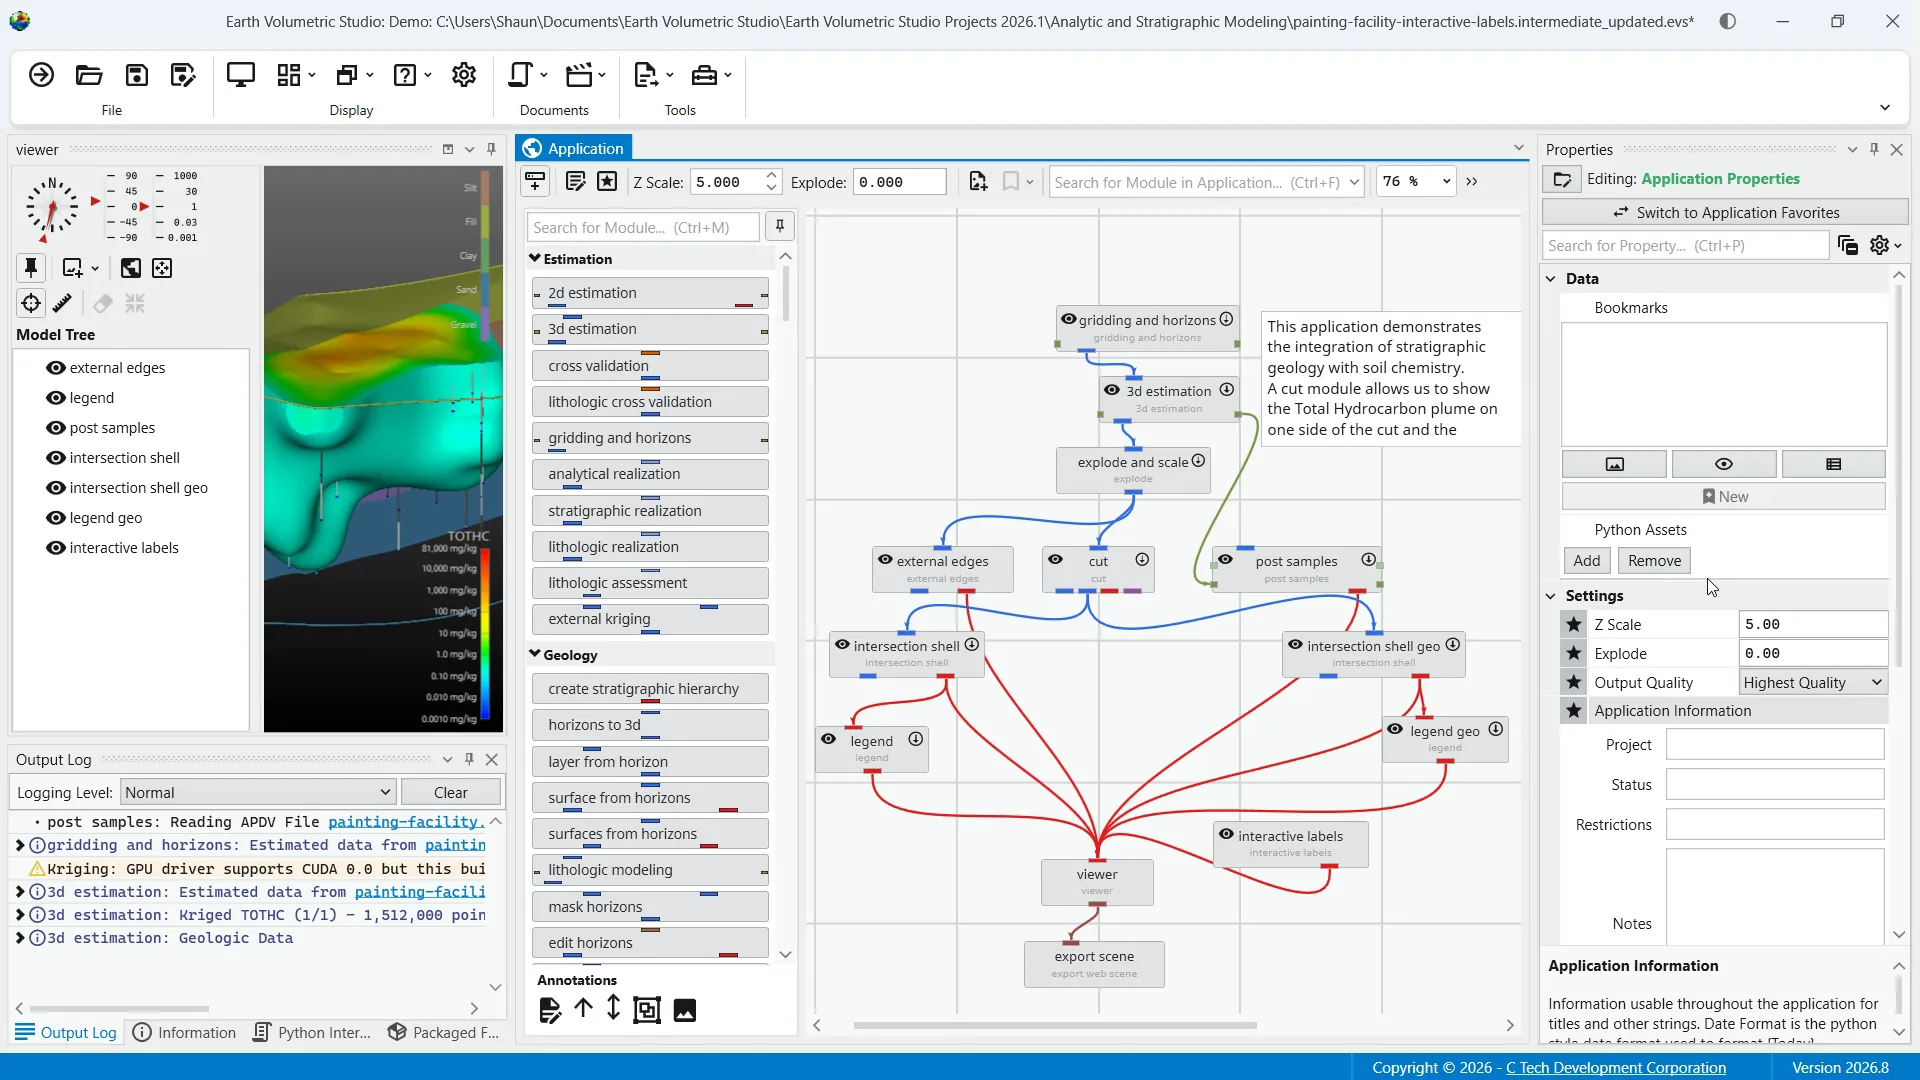
14Application Colors
This feature provides a centralized way to manage a consistent color palette across your entire application, which is also ideal when used with link properties, as it allows you to switch between entire color themes with a single click. Linking will be discussed momentarily when we look at module properties.
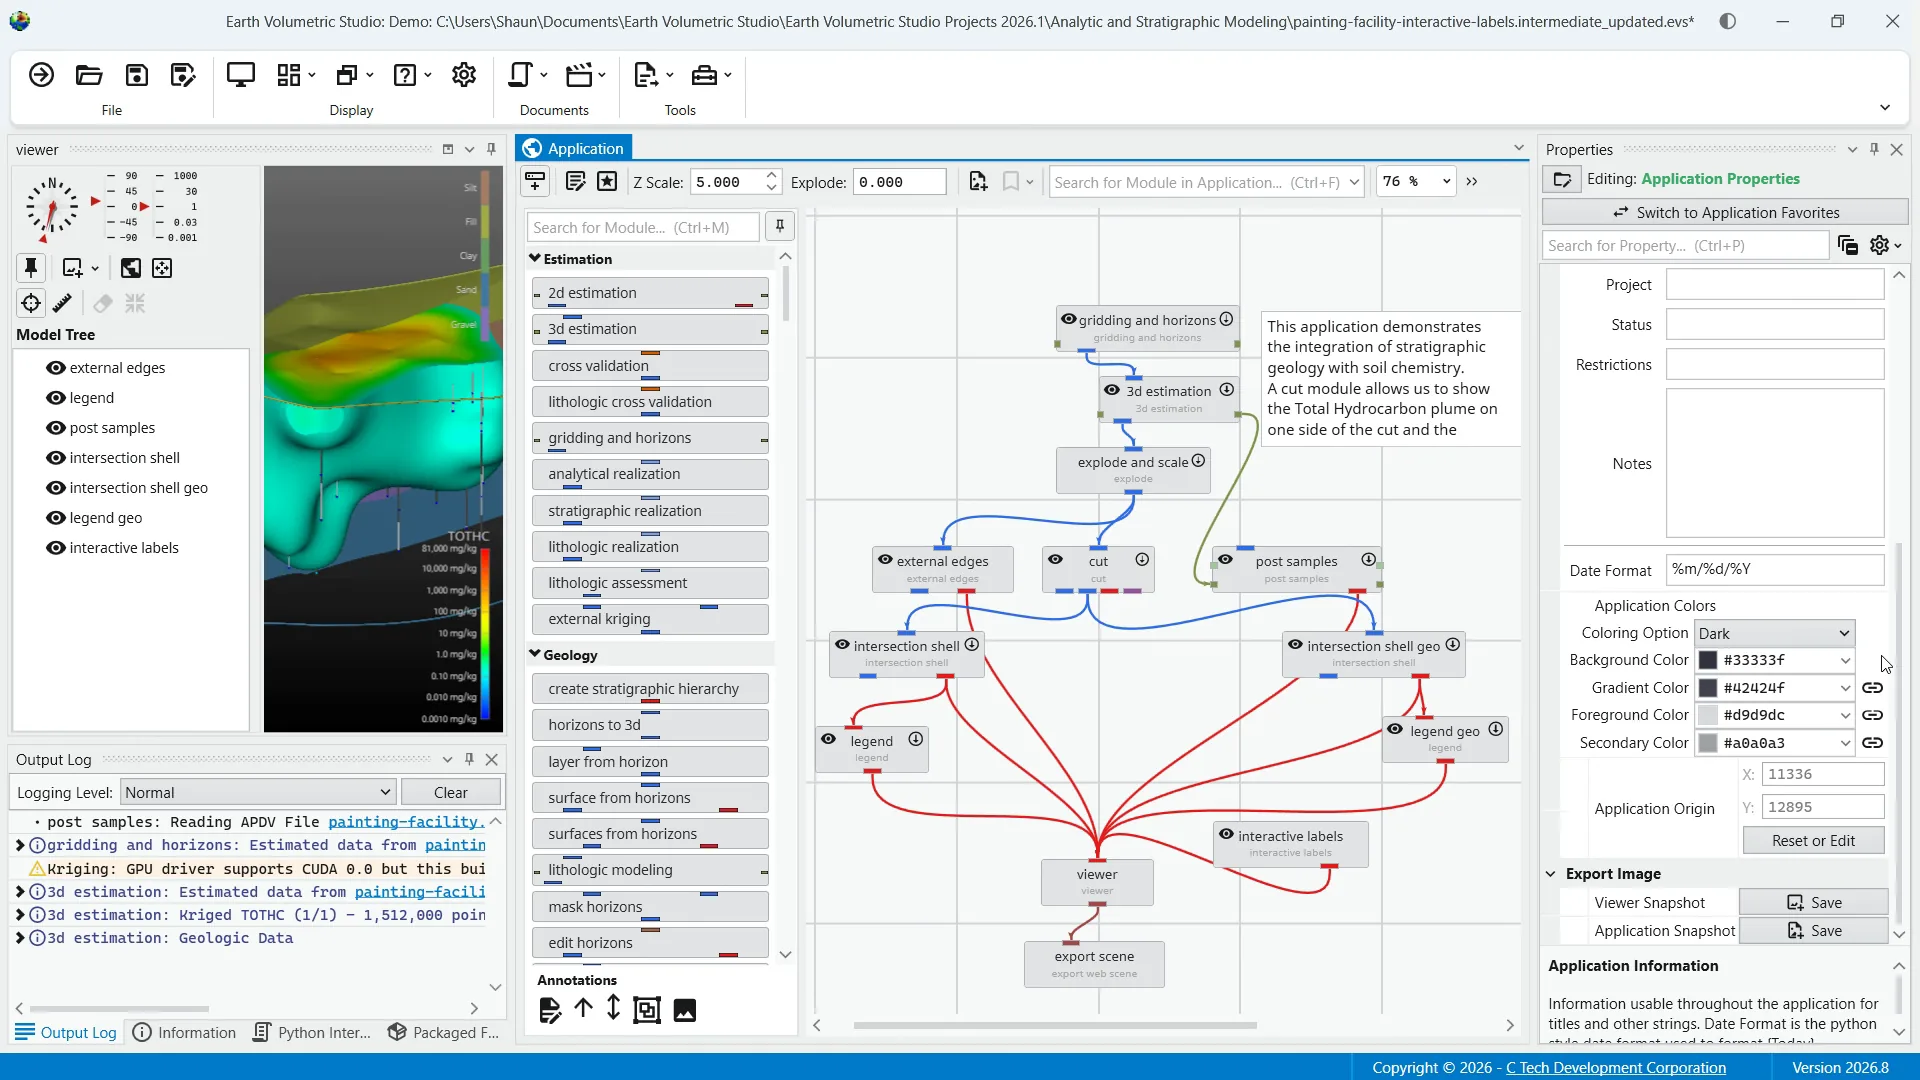
15Additional Options
Next, we have application origin to define the spatial anchor for the project coordinates. This is something you can reset or edit to manually calibrate the center of your project. Viewer snapshot writes the contents of the viewer to an image file.
16Application Snapshots
And finally, Application Snapshot writes the content of the application window, also to an image file.
17Selecting a Module
As mentioned previously, when you select a module in the application network, its settings are now displayed in the Properties window.
18Module Properties
This allows you to configure the module's parameters and control its execution behavior. We already touched on the function of the switch to display properties button to quickly toggle between module properties and output port properties for that module.
19Execution Control
Beneath that you have execution control tools. The run toggle controls the module's automatic execution. By default this is always on, meaning the module will automatically run whenever one of its properties has changed, or when an upstream module it depends on finishes running. Toggling this off prevents the module from running automatically.
20Manual Execution
This is also displayed on the module in the application network. The "execute" button allows you to manually trigger the execution of the currently selected module. It essentially forces the module to run a single time, which can be useful when the run toggle is off, as it lets you apply your changes and see the result without having to re-enable automatic execution.
21Unique Module Parameters
Below the execution controls and the search bar, the properties sections contain all of the configurable parameters for the selected module. These settings are unique to each module's function and allow you to customize the module's behavior to fit the specific need of your analysis. An important part of this customization is the ability to link and unlink properties.
22Link and Unlink Properties
Linking as shown with this icon is when a parameter's value is automatically determined within the application rather than being set by the user. This dynamic connection allows for a more intelligent, consistent workflow by having the value automatically update based on its source. Conversely, by clicking on the link icon to break the link, you're able to fix a value to whatever you decide to manually set.
23Linking Recommendations
While you can unlink a linked property to gain manual control, it's genuinely recommended to keep properties linked unless you have a specific reason and fully understand the effect of the change. It's important to note that not all properties are linked. If there is no link icon next to a property that is set manually by the user, it will not be updated automatically.
24Common Linked Properties
Common categories of linked properties are Z scale, coordinates, and the aforementioned application colors.
25Access Port Properties
The other window we'll cover is port properties. This can be accessed by double-clicking on an output port within any module or from clicking on the switch to display properties button from the module properties. The window displays detailed information and settings for that specific port.
26Common Port Property Elements
While the properties shown vary depending on the type of data the port provides, there are certain elements that are common to all ports. For example, all output ports display information such as the port name, expandable port detail, as well as your general options and the search feature. Two of the more common port types are renderable object ports displayed in red and field ports shown here in blue.
27Renderable Object Ports
The renderable object port outputs a visual object such as a surface, set of points, or a volume that can be displayed in the viewer window.
28More Info in Help Documentation
A full breakdown of the many properties of this port type can be found in the help documentation.
29Field Port Functions
The blue field port is the most common port type and is responsible for passing grid structures and their associated data between modules. Field ports have a wide range of capabilities where you can configure statistics and coordinates as well as utilize a statistics window to provide a comprehensive and interactive environment for analyzing the data within a field. Again, a full range of details on the properties for field ports can be found in the help documentation.
30Datamap Editor
Lastly, we'll quickly go over the datamap editor.
31Datamap Editor Purpose
For reference, a datamap is a fundamental concept that serves as the bridge between raw numerical data and its visual representation. In EVS, the datamap editor is the primary tool to communicate the meaning of your data within a visual context. It allows you to create and customize the mapping between your data values and the colors used to represent them by controlling color gradients.
32Access Datamap Editor
You can also manipulate data ranges and scaling to highlight features of interest in your data represented in a visualization. To access this powerful interface, click the edit button next to the node datamap or cell datamap in the renderable object ports properties window.
33The Editor Interface
The editor will be presented with a toolbar at the top, a color ramp preview in the middle, and a color break editor at the bottom.
34File and Replace Options
In the toolbar, you'll see operations such as opening a previously saved datamap, save options, and using a template to apply a default datamap template. Next, we have "copy from" and "copy to" functions to move a datamap to or from another module.
35Settings Options
Settings include lock adjacent breaks to lock the colors between breaks, gradient color ranges to control the use of smoothly changing colors, and "use perceptual color space" to switch the color interpolation method, which can produce gradients that are perceived as more uniform and natural to the human eye.
36Operations Tools
Within the operations tools, you can add breaks, clear breaks, flip ranges, which reverses the color ramp, evenly space breaks, create breaks from bands, and apply geographic mapping.
37Geographic Mapping Feature
This last option is designed for categorical data, creating a series of discrete solid color ranges corresponding to the integer IDs used to represent different geologic materials.
38Color Ramp Preview
Lastly, the color ramp and break editor is the main interactive part of the editor where you can define the datamap. The first thing you'll notice is the color ramp preview. This displays the colors and the smooth transitions between them based on the color breaks you have defined below it.
39Color Break Editor
The color break editor is the section where you define the specific points of your datamap using one or more color intervals and the points that define the intervals at the color breaks. Each color break is represented in the editor, which includes a data value input box for a precise numeric entry, and a color swatch to set the color of the break.
40Thank You For Watching
And that is an overview of the properties window in the EVS environment. Thank you for watching.
Summary
This tutorial provided a comprehensive overview of the Properties window in Earth Volumetric Studio, covering how to access and manage object properties with configuration options, and utilize the datamap editor. By following these steps, you can efficiently customize and control your application's parameters and visualizations.