
Introduction
This tutorial introduces Earth Volumetric Studio's application window. You will learn how to navigate the interface and utilize key features to build effective data processing applications.
In the demonstration, we will be looking at EVS's application window as a central workspace for creating and managing your data visualization workflows.
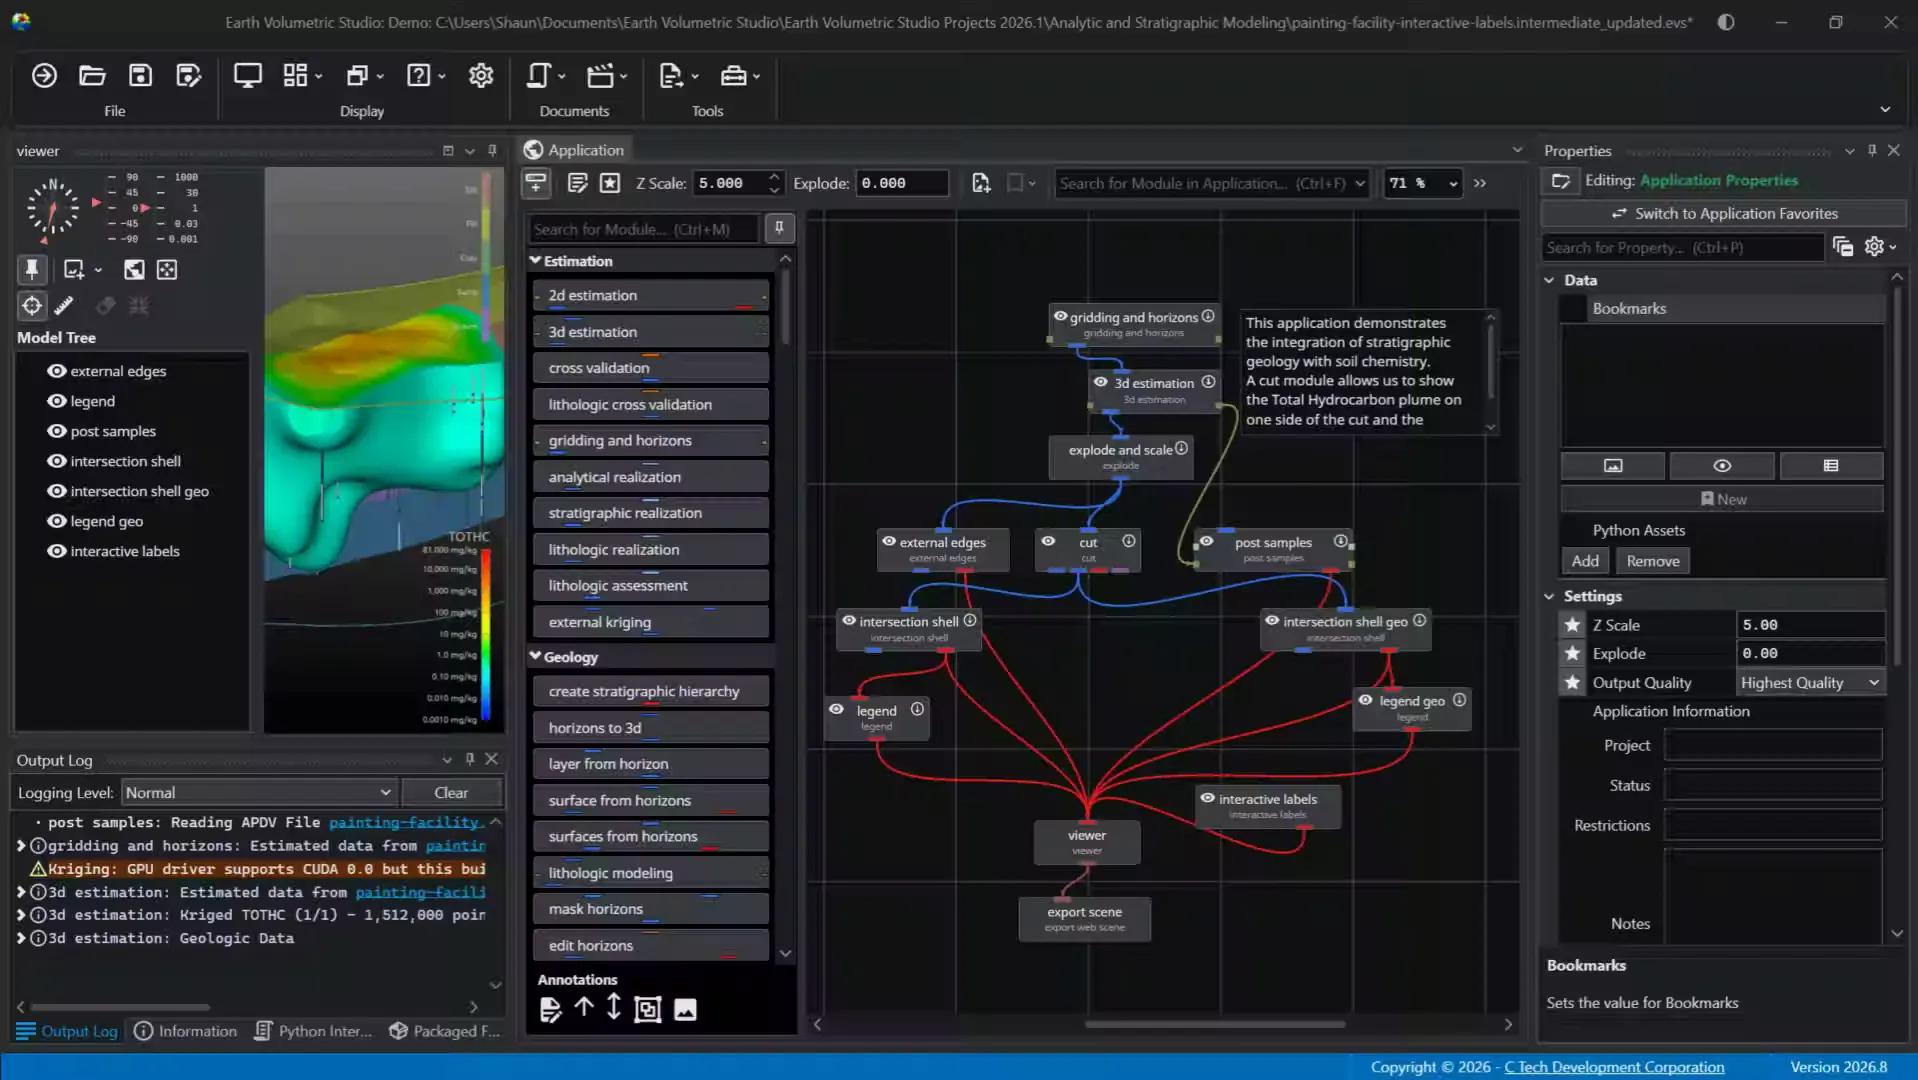
The application window provides a visual node-based environment where you can build networks by placing and connecting modules to define data flow. The first thing you'll see in the window is a toolbar on top. This provides quick access tools and settings for managing your application.
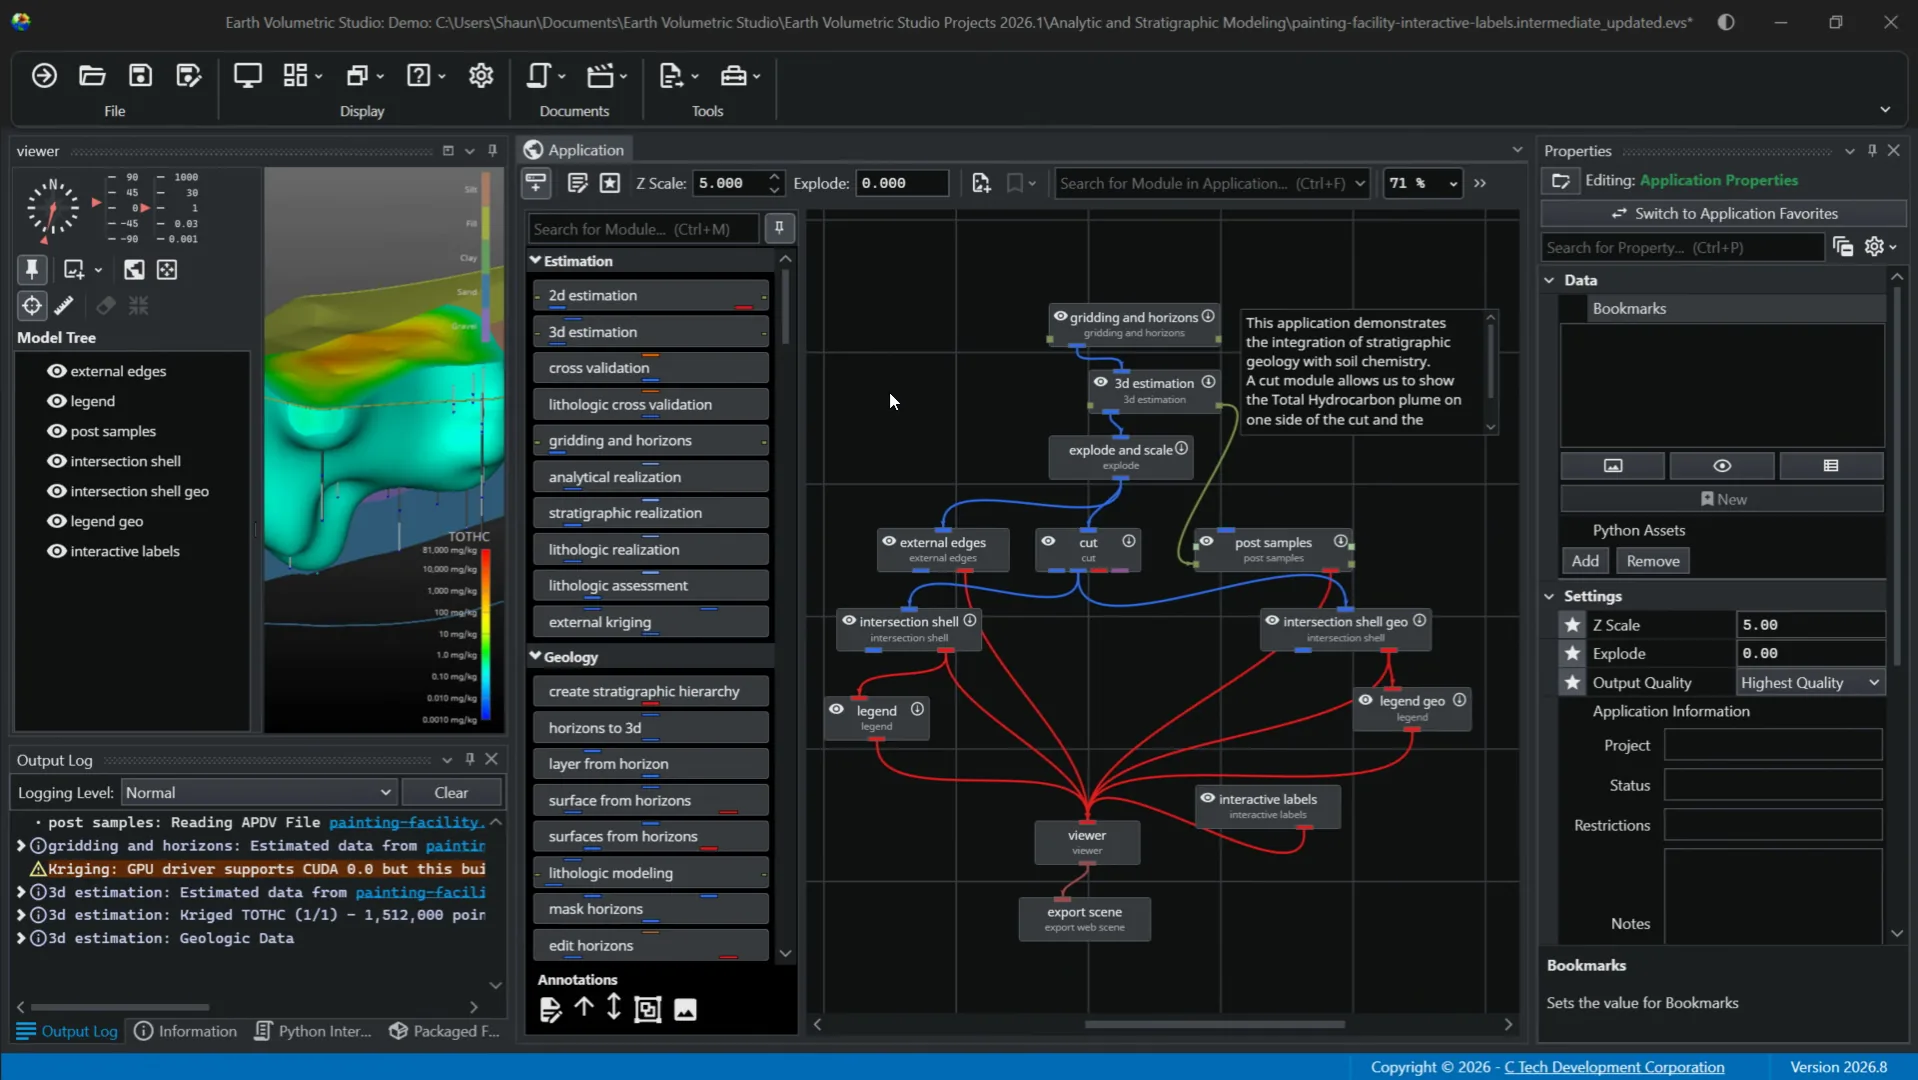
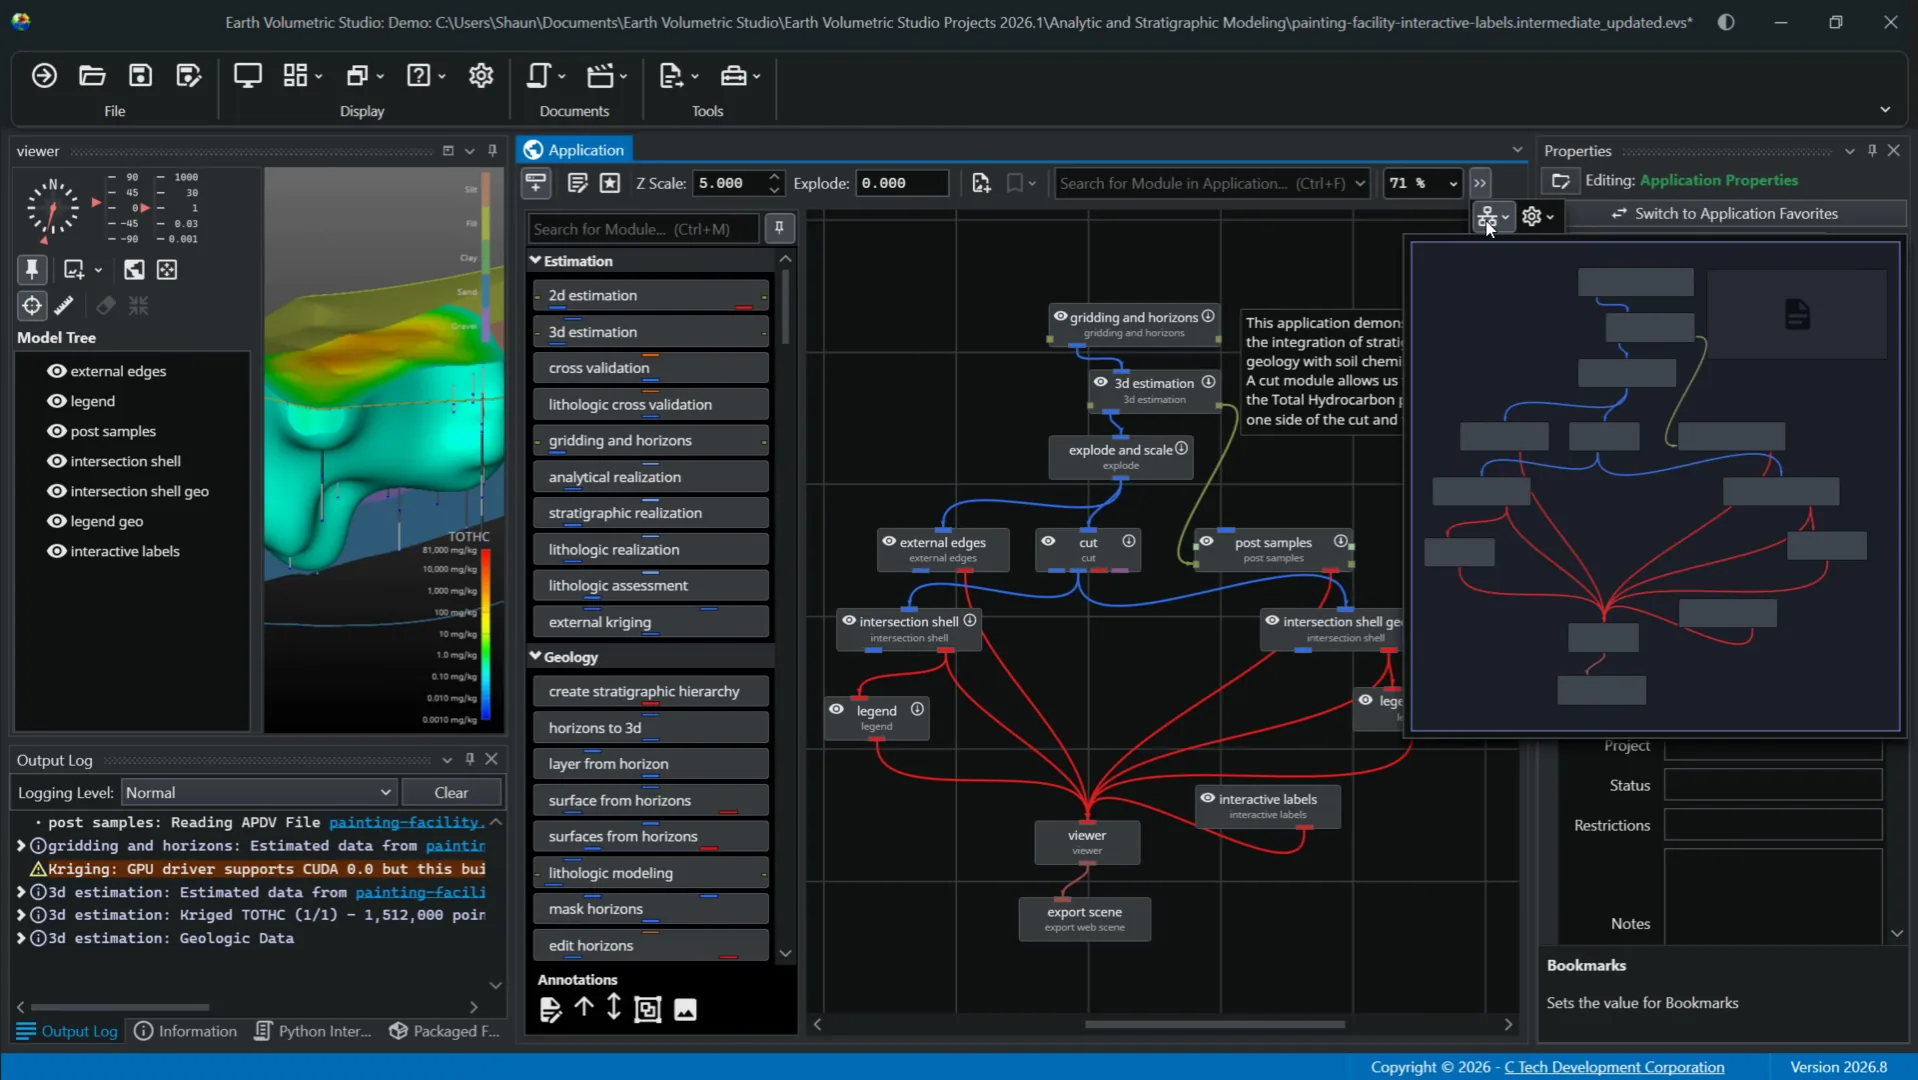
Options include a toggle for visibility of the module library, edit application properties, and edit application favorites, both of which open in the properties, which we'll focus on more in a dedicated video for that window. There are Z scale and explode manipulation controls with results reflected in the viewer window, create snapshot to save a snapshot of the current state of the application network. The toolbar also has bookmarks functionality, a search bar that we'll go over more a little later, zoom level, and application overview to show a high level view of your application network. This can be useful for large complex applications. You are able to zoom in on a certain part you are working on.
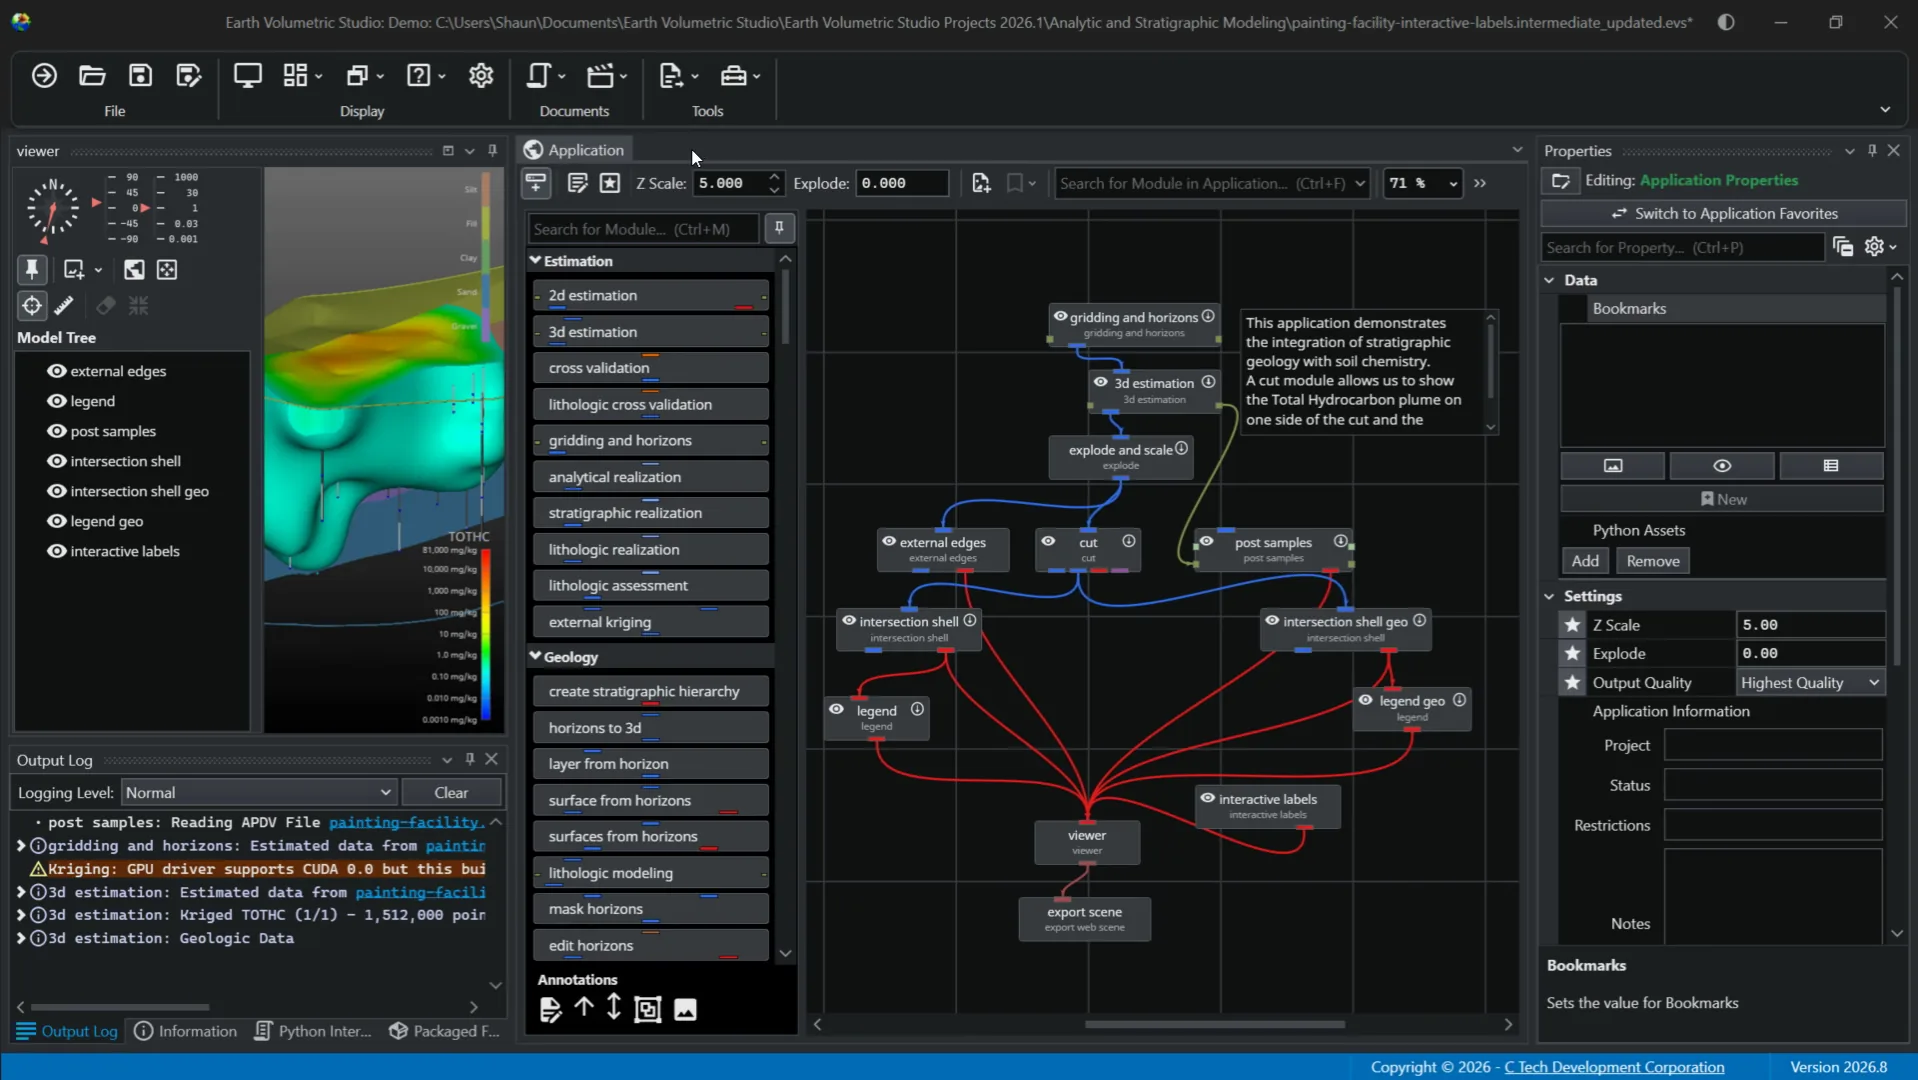
You also have an options menu containing settings related to connections and the module library. Many of these options let you customize viewing preferences to optimize your workflow. The next thing you'll notice about the application window is it's divided into two main sections, the module library on the left and the application network on the right. We'll look at the module library first.
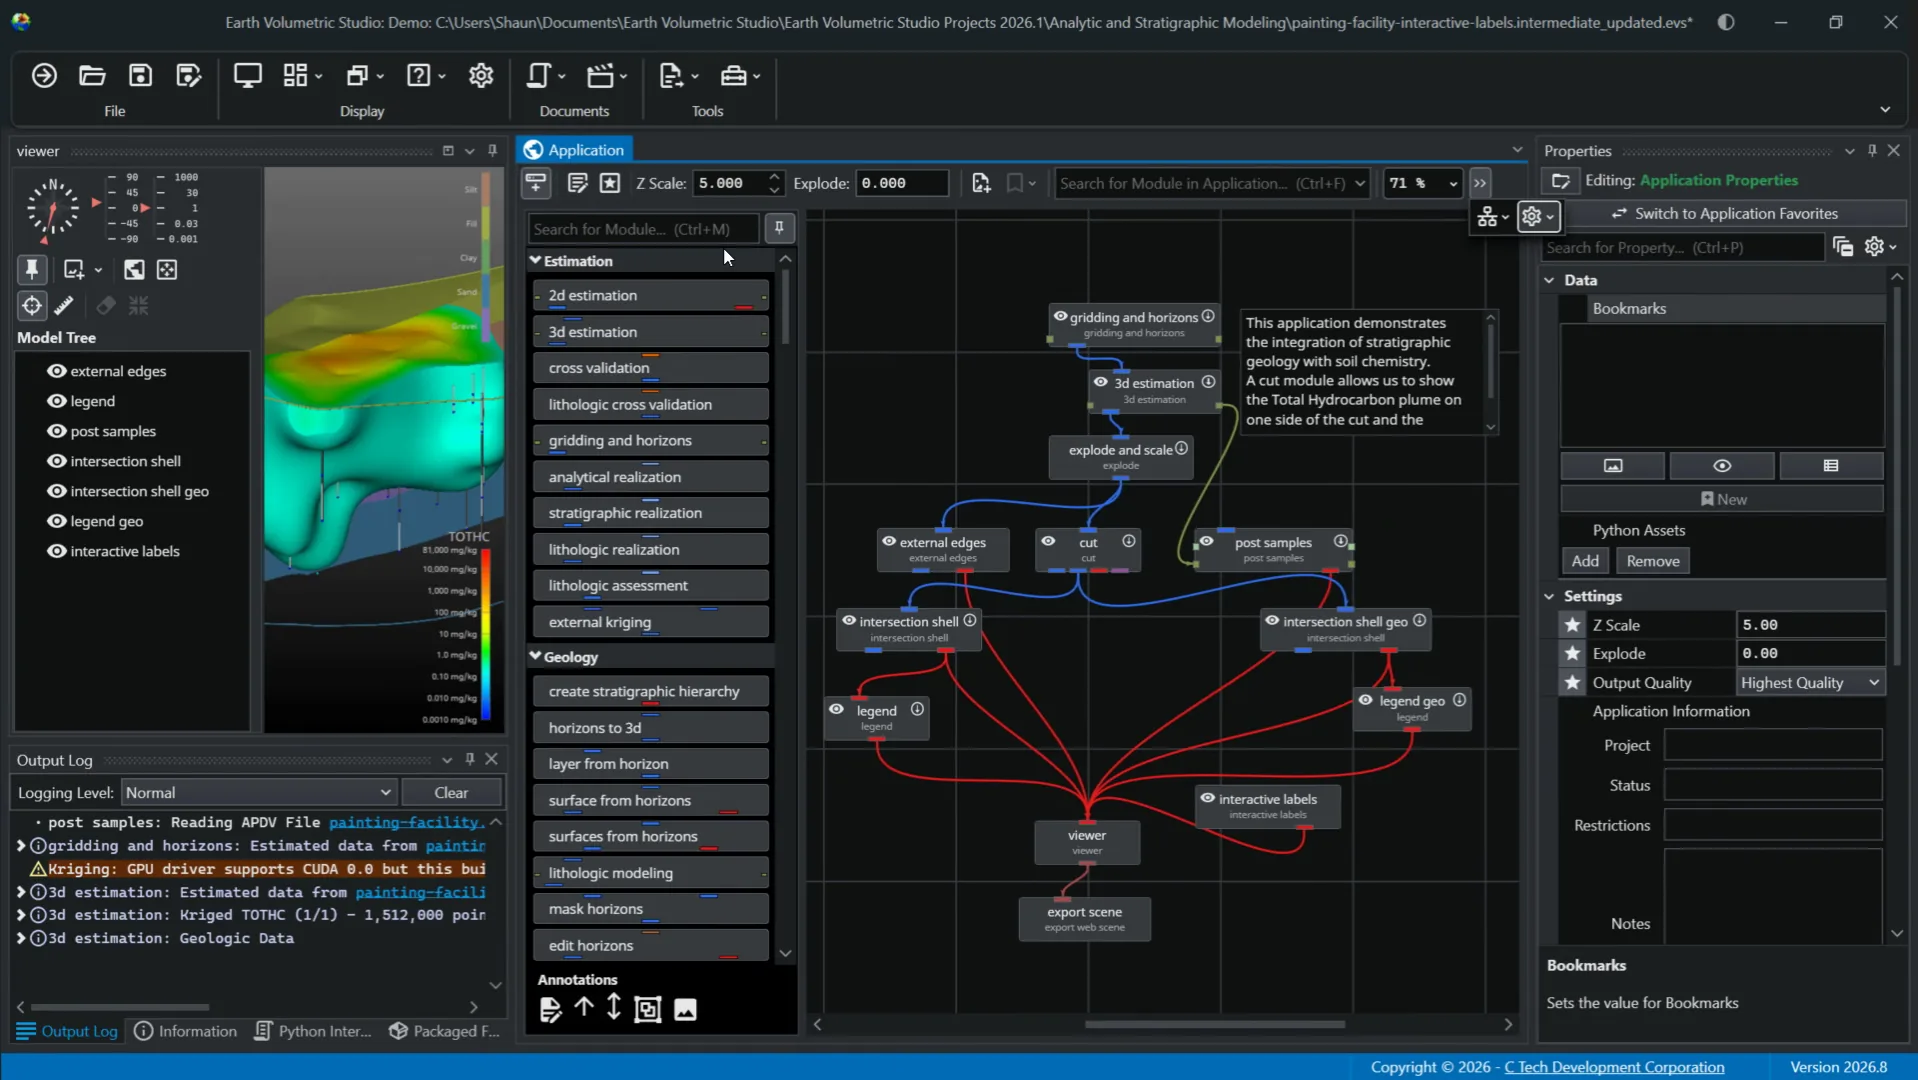
The module library is an important component of the application window. It serves as a central repository for all the modules used to build the data visualization and all processing workflows. Unlike other windows, the module library cannot be undocked. It can, however, be hidden when not in use. In the module library, modules are organized into collapsible categories such as estimation, geology, and so forth. This allows you to easily find what you need in your workflow. Additionally, the module library has a search function to quickly filter the list of modules. As you start typing in the search bar, the library will display names of modules that match your specific search query.
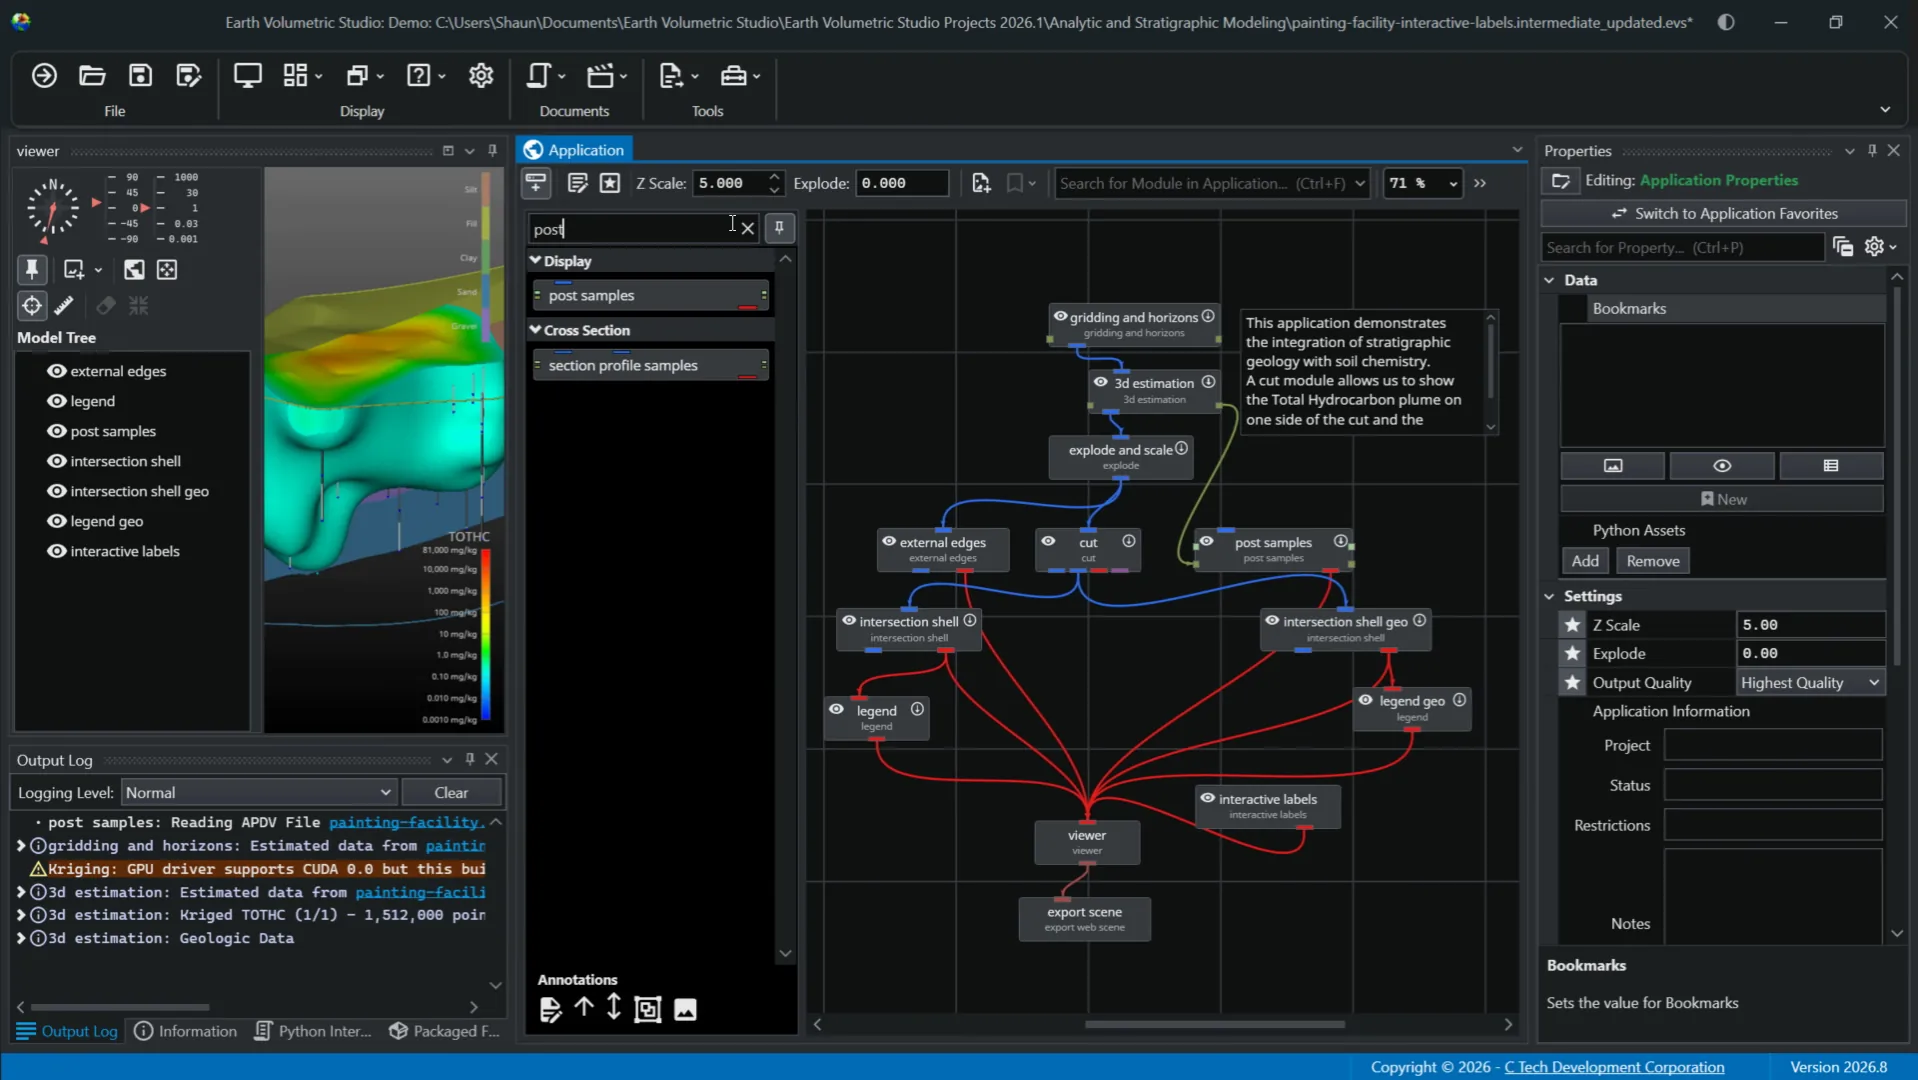
You'll also notice next to the search bar is the pin feature. This button controls the auto-hide behavior of the module library. If you unpin the module library to auto-hide the window, you can always click on the Show Module Library button or use the Ctrl-M keyboard shortcut to reopen that window at any time. Another important feature of the module library is the annotation section at the bottom. These are a set of tools for adding visual annotations to your application network and can help with documenting your workflow, clarifying connections, and organizing complex applications.
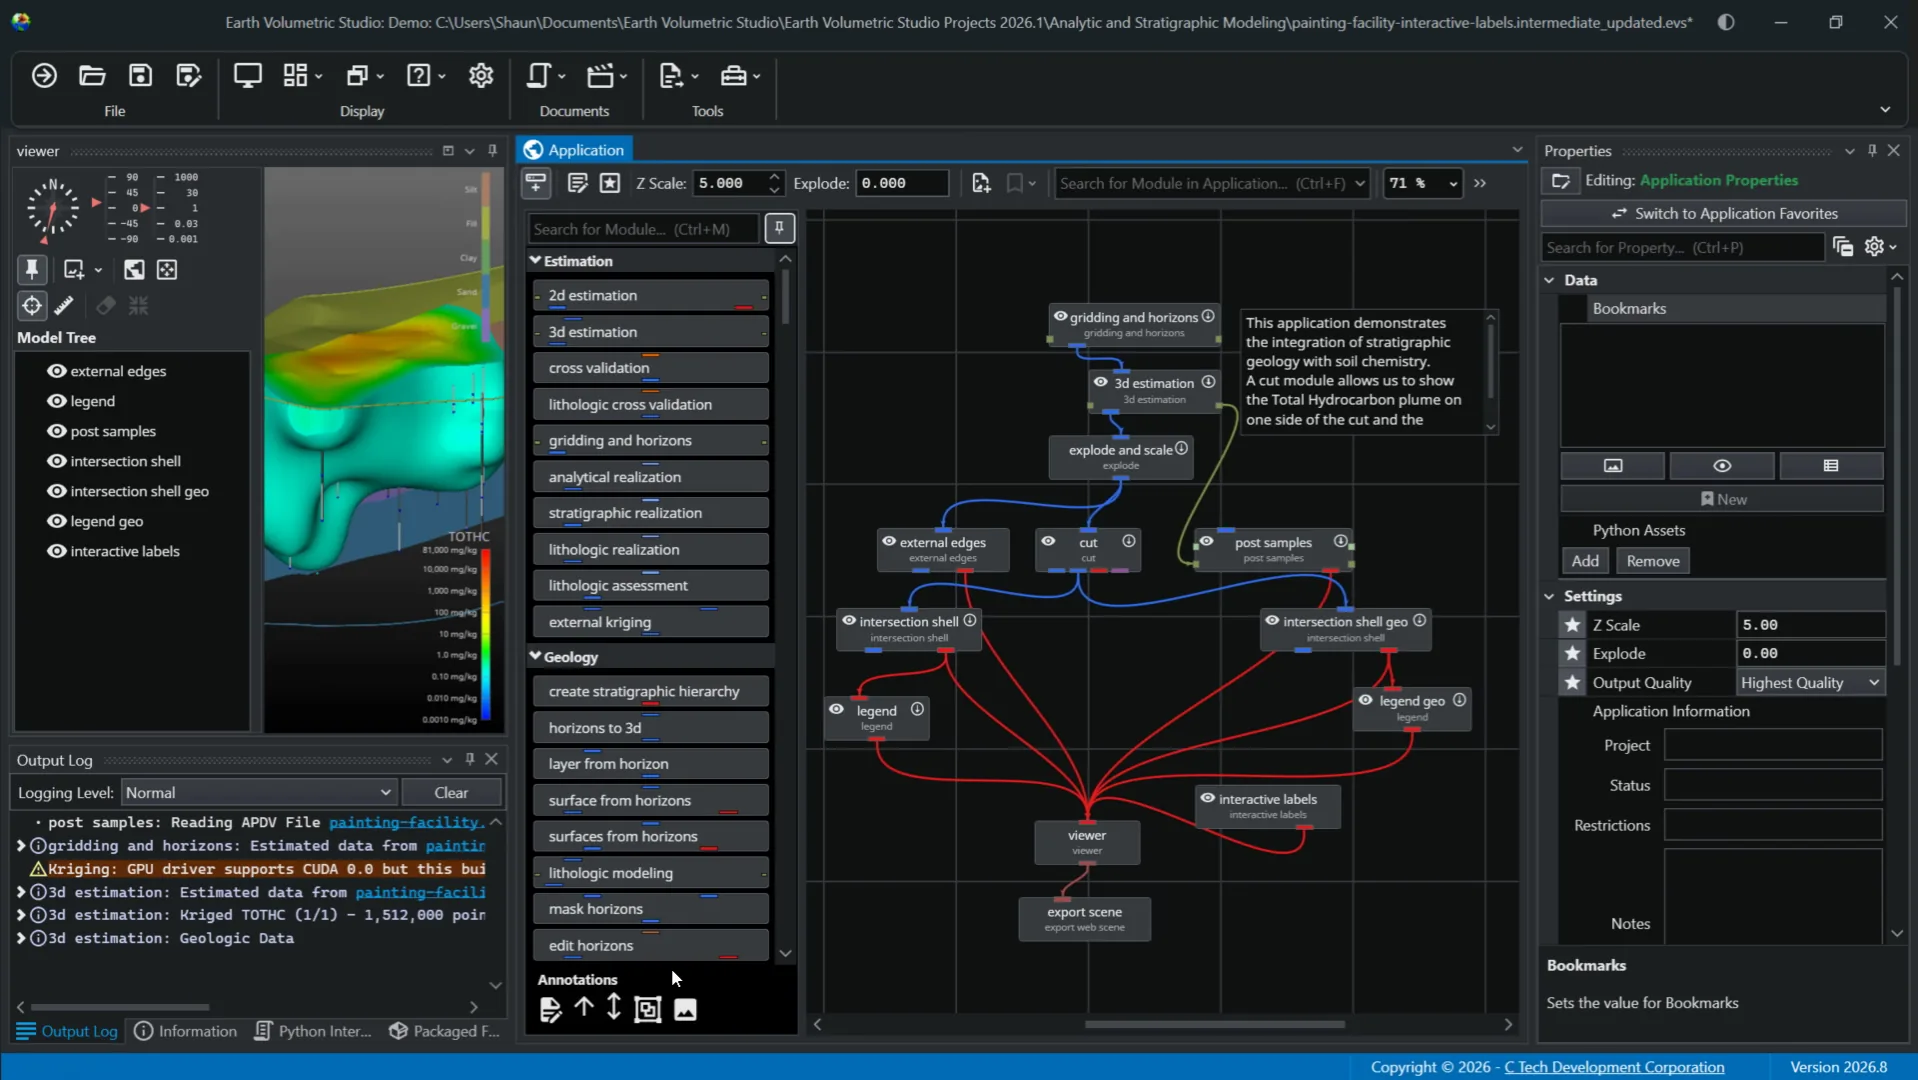
Let's look at some of the options. First, you can add text annotations. Here you can add notes, titles, or descriptions for different parts of your workflow. Next, we have two line annotation options to draw arrows on the canvas. These can be useful when pointing to specific modules or visually grouping related items that may not be physically close to each other.
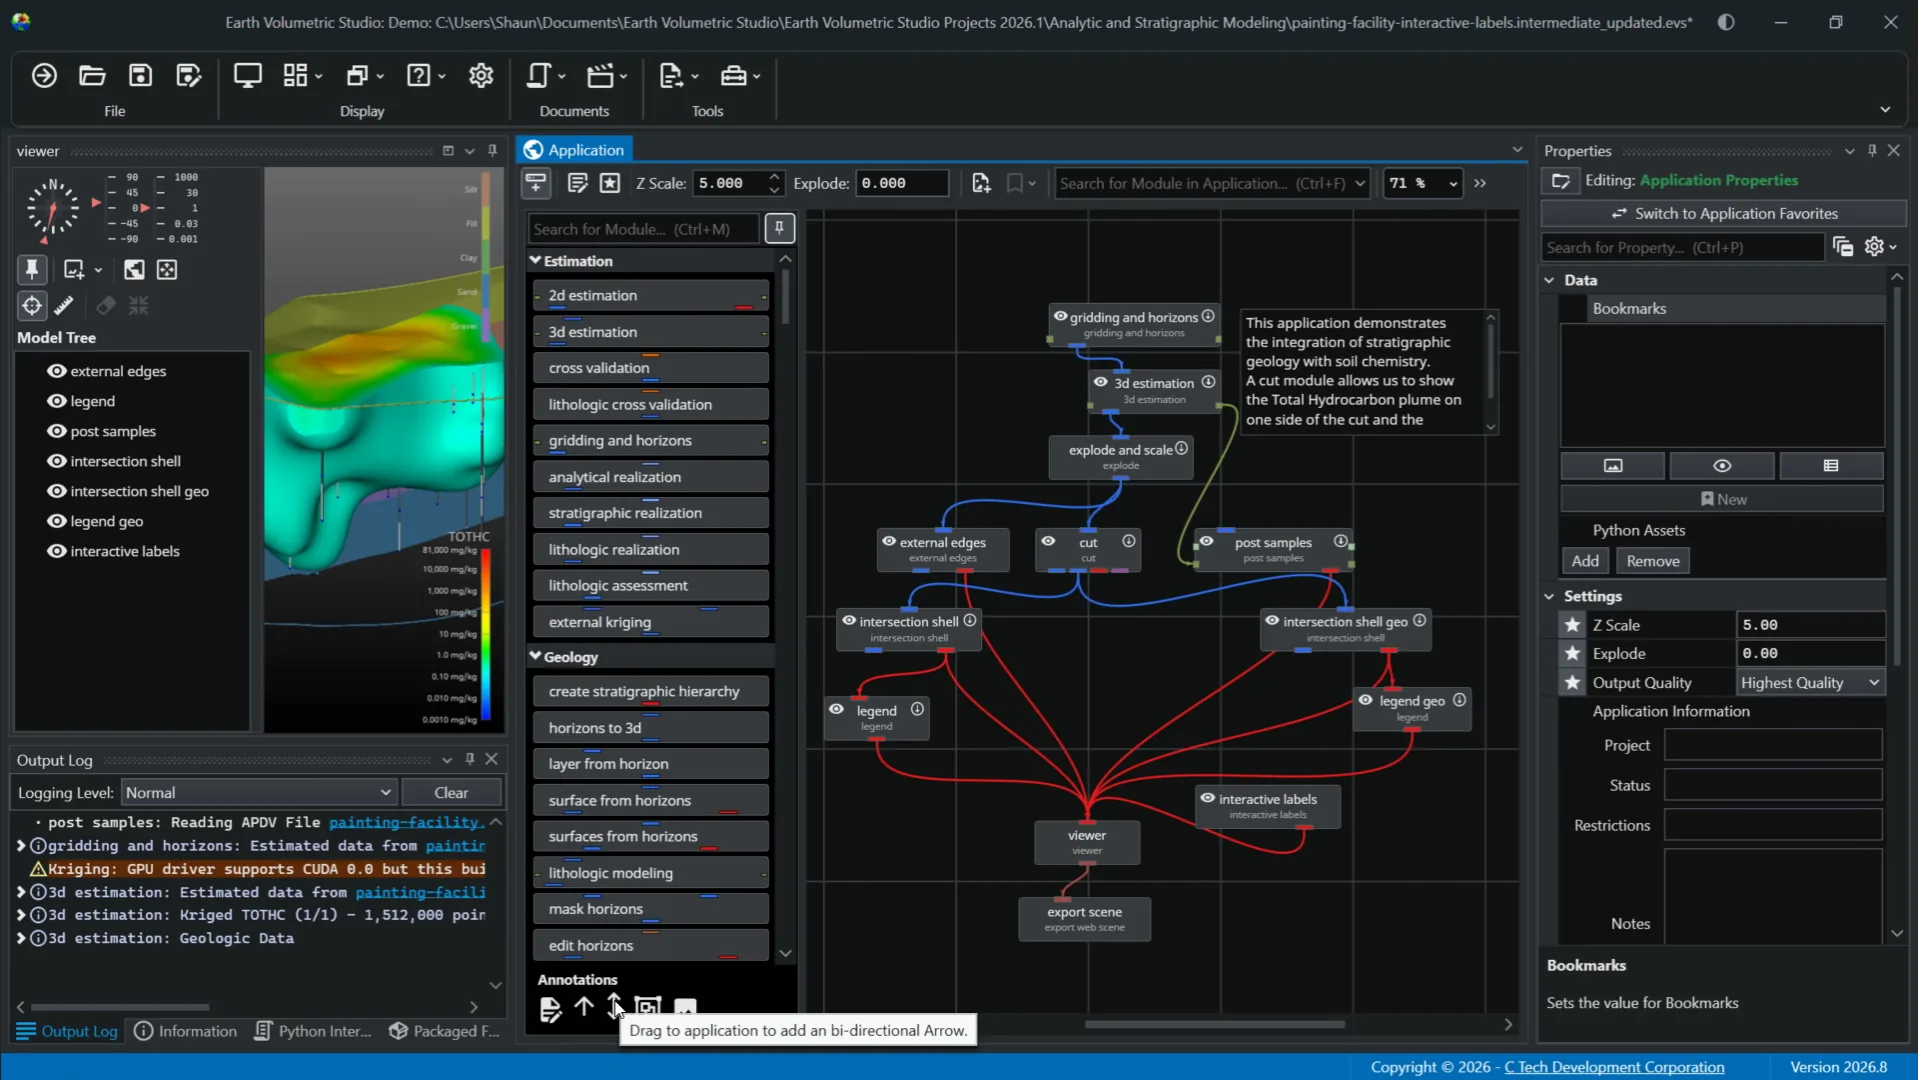
The group annotation creates a container for a set of modules. You can drag modules inside a group annotation to organize them as a unit. This group can be named, resized, and collapsed to help simplify your view when you have a large complex application network. And lastly, we have the image annotation where you can add an image from a file directly into the application network canvas. This can be quite useful if you plan on adding a logo, diagram, or other visual aids to your workflow documentation.
Next, we'll explore the application network side of the window. This is the primary workspace in EVS for building and managing your data processing workflows. On this canvas, you can construct applications by placing and connecting modules to define data flow input to final visualization in the viewer window. First and foremost, modules are the fundamental building blocks of an application. Each one performs a specific task.
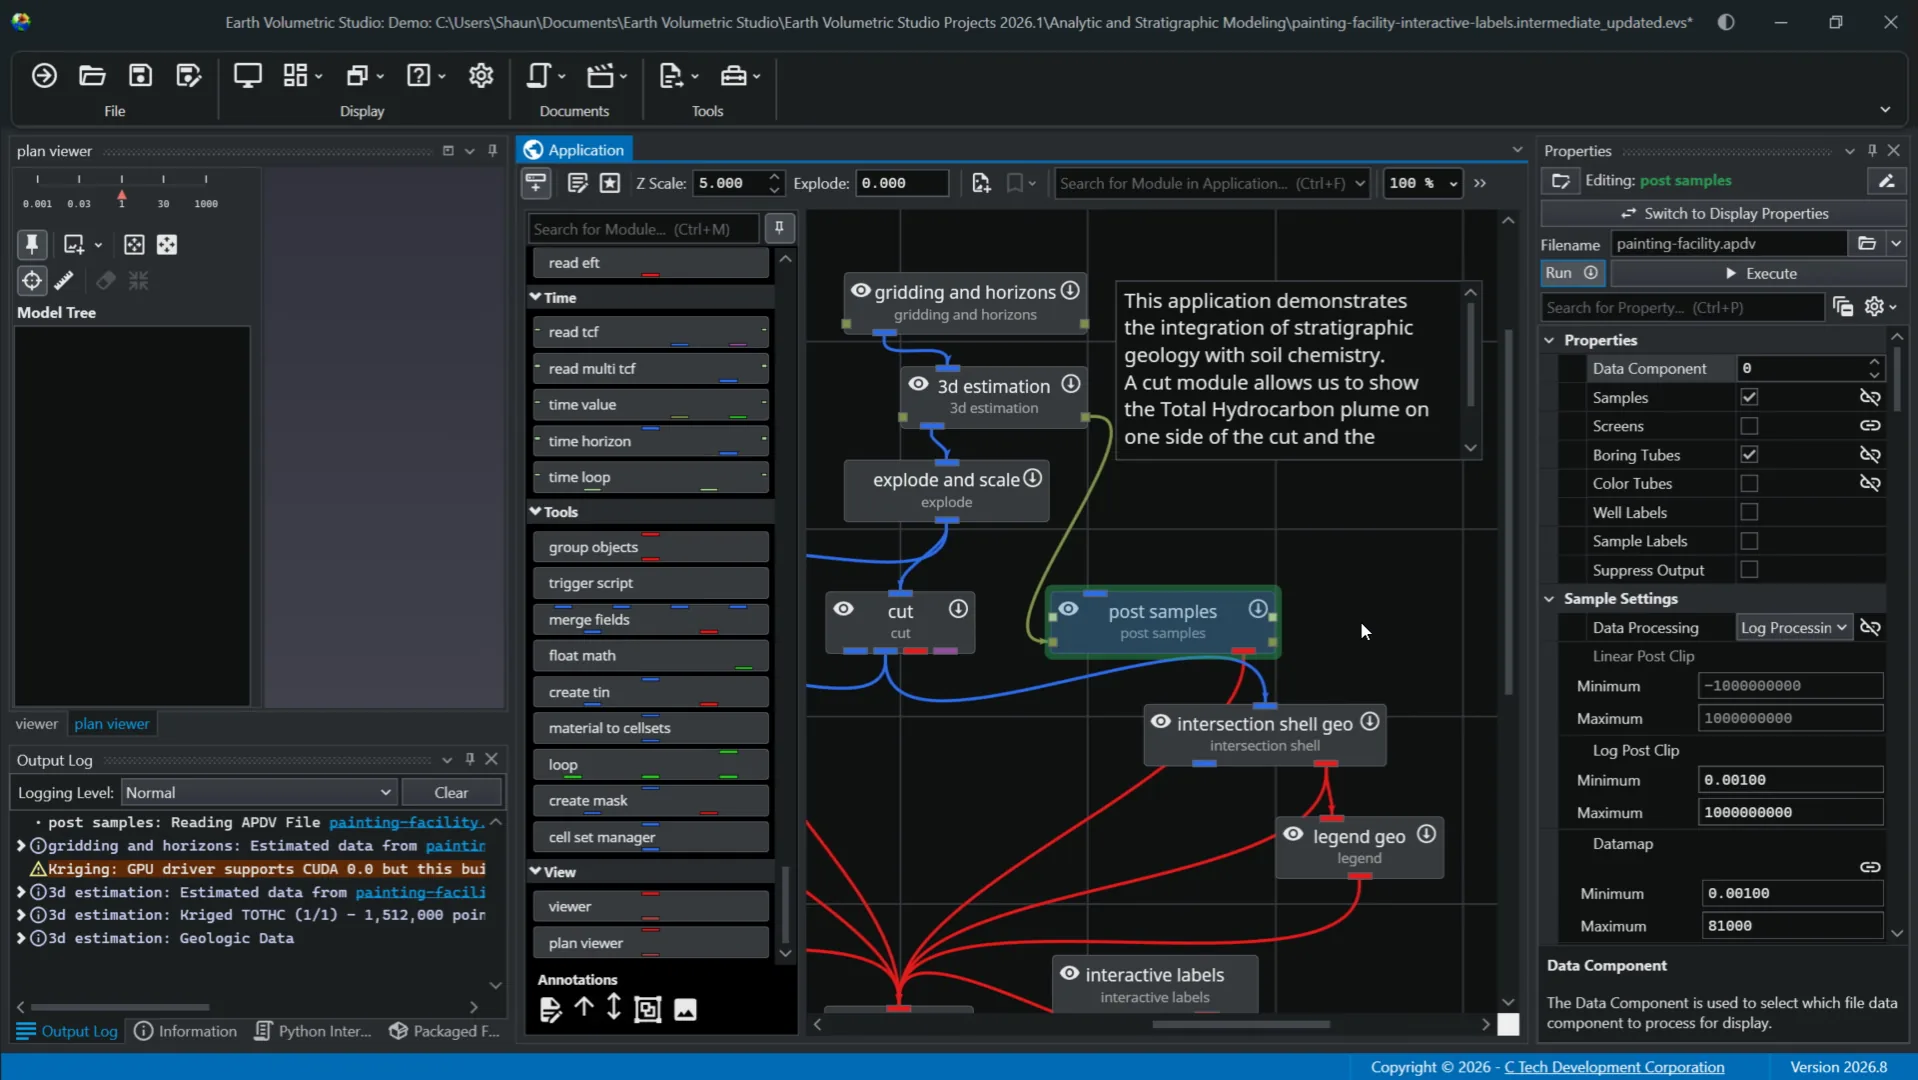
These are represented by rectangles like this and have user-defined names and the module type under it. You can easily add modules to your network by dragging them from the module library. The application network also shows how modules communicate with each other through ports. Each module input ports on the top and output ports on the bottom are color coded to indicate the type of data they handle. The two most frequently used ports are renderable object ports, shown in red, and field ports shown in blue. The renderable object ports handle renderable geometry and connect to the viewer window to display objects. This port contains the fields, data, and rendering information necessary for visualization. The blue field port is one of the most common port types used to pass data sets between modules that create, modify, or subset the data. Note there are many port types and subtypes available to use when creating your workflows. A more comprehensive list with color designations can be found in the help documentation.
Next, you can create connections between modules to represent the flow of data from an output port of one module to an input port of another. Creating and removing these connections are fundamental to building and modifying your application's workflow. To create a connection, simply use your mouse to drag a line from an output port to your target module. While holding the left mouse button down, you will see all compatible input ports highlighted, indicating where a valid connection can be made. You can then release the mouse button once on the highlighted port of your choosing. To remove a connection, simply move your cursor to the connection you want to remove, click on it, and press the delete key on your keyboard. The connection will be removed if you confirm the warning that pops up. The other method for managing port connections is with the input port and output port context menu. This can be useful for making connections when you have complex applications or modules are far apart, making dragging impractical.
To access this menu, right-click on an input port or output port on the source module you want to connect from. From there you can select the "Connect To" option. This will give you a dialog window that lists all compatible ports available in the application. From here, just choose the target module and port from the list and the connection will be created automatically.
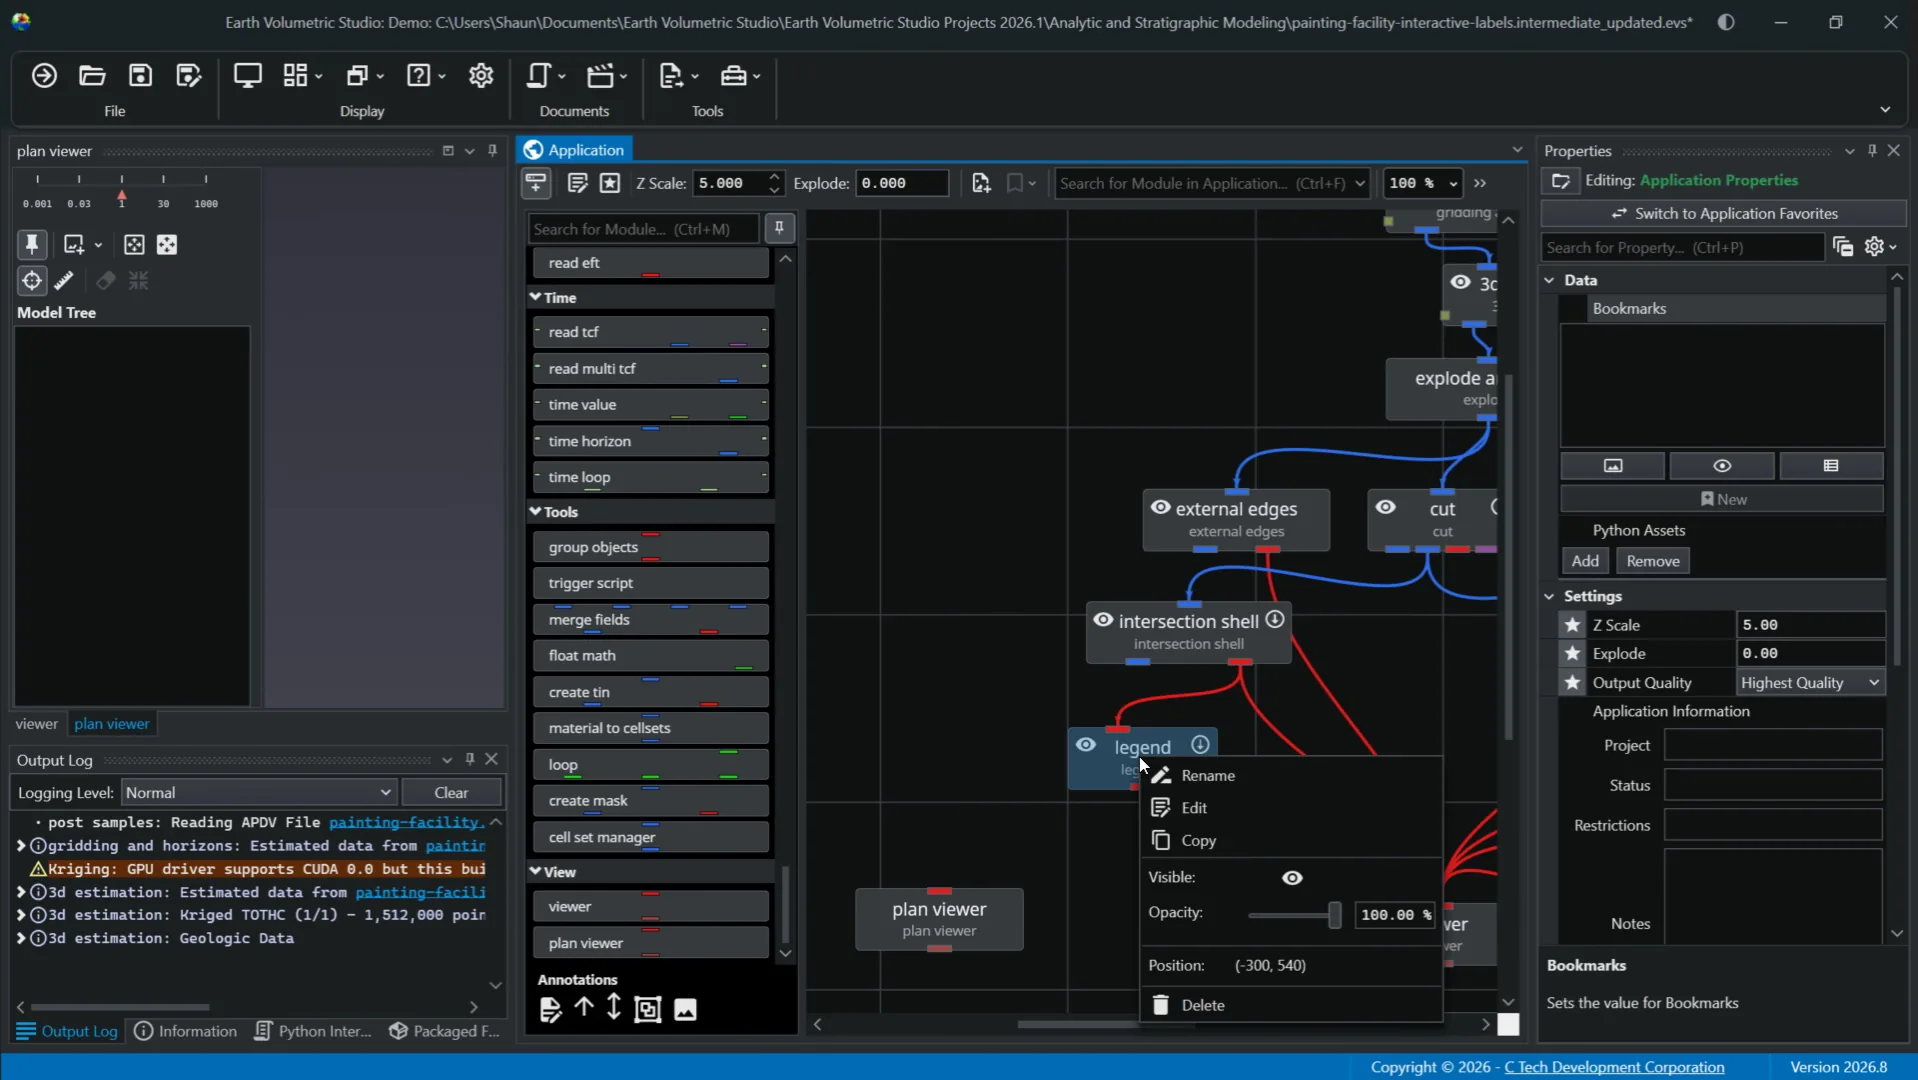
You can also right-click on any port to get additional information such as name, type, subtype, and some connection options. You can disconnect a connection entirely by right-clicking on the connection line itself. Aside from ports and connections, you can right-click on a module to pull up a context menu that provides quick access to several common actions and properties for that module. These include renaming, editing parameters in the properties window, copying the module including its current settings, a visibility toggle, opacity control for the module's visual output in the viewer window, position, or deleting the module altogether.
Next, we'll take a look at how modules in the application network display visual cues to indicate their status. These indicators allow for efficient management of your application window by quickly allowing you to understand which module is selected, has run successfully, or set to execute automatically.
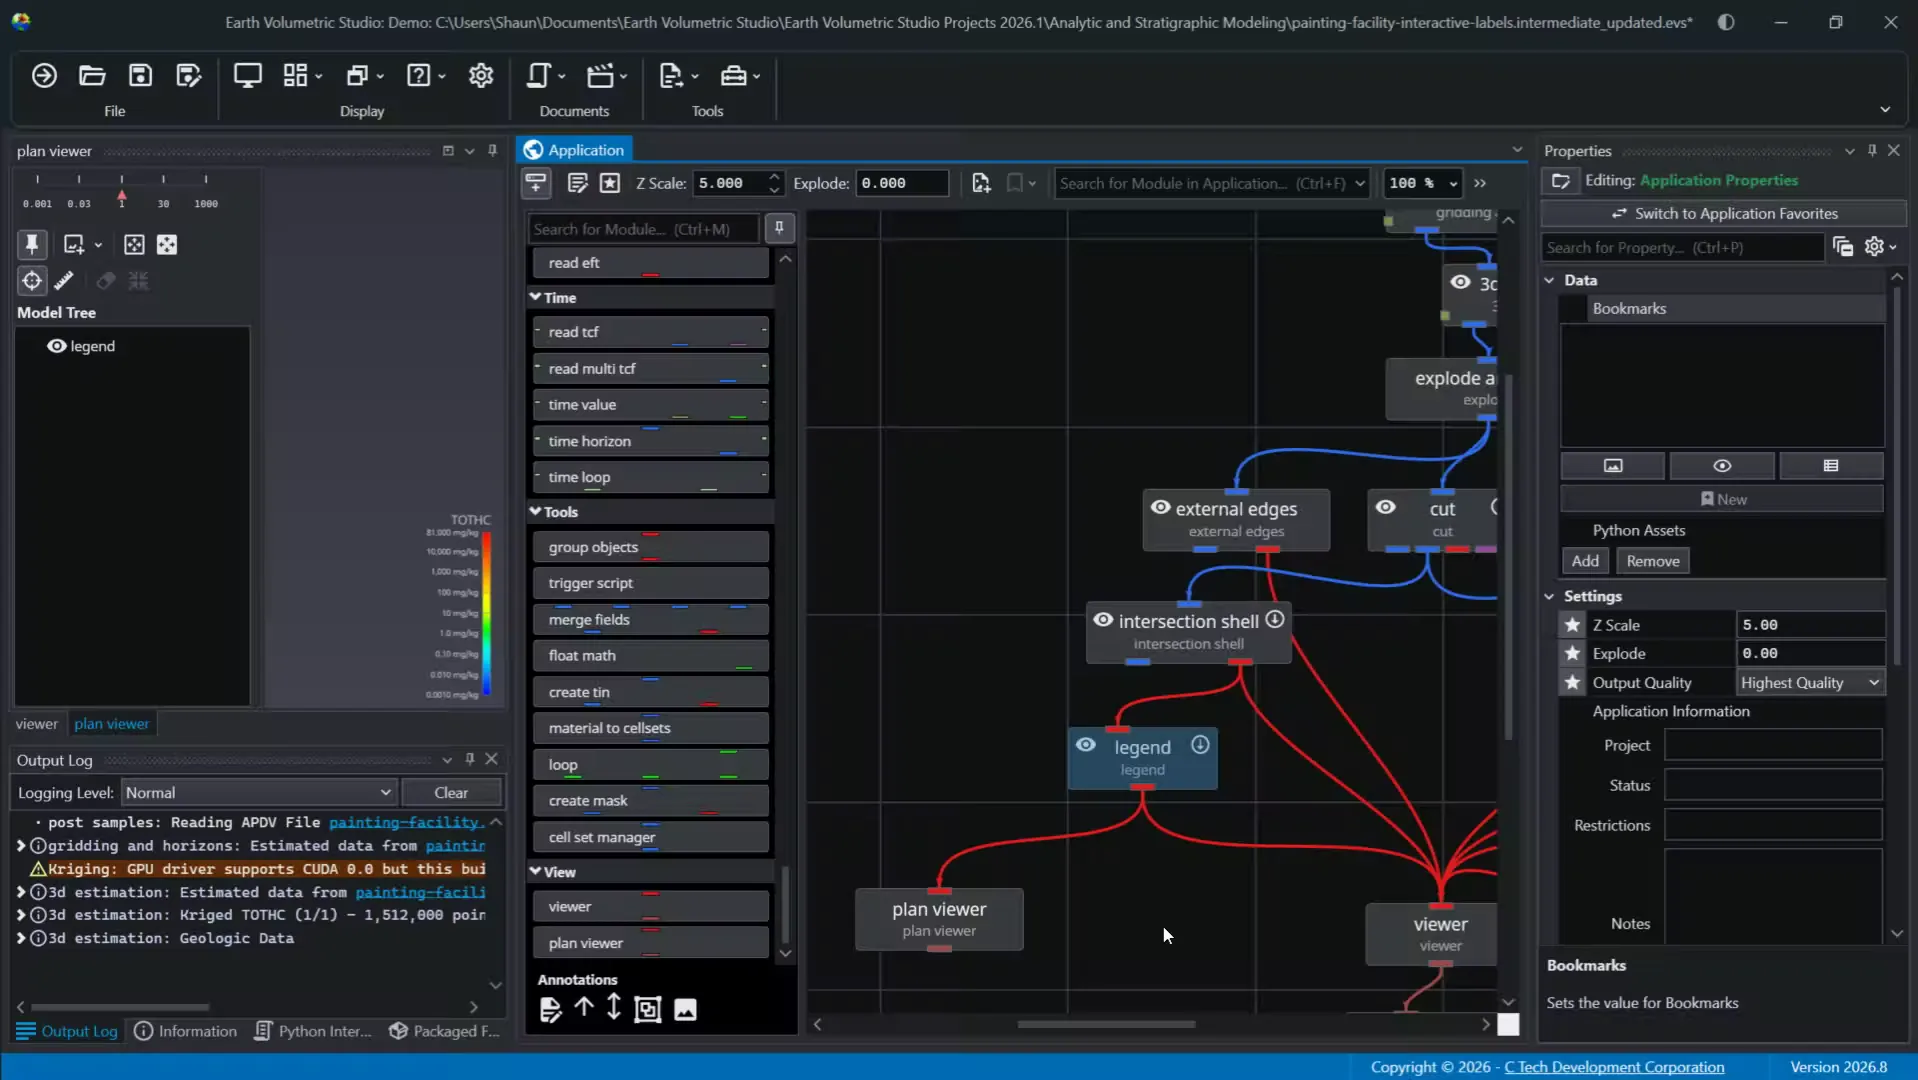
For instance, when you single click a module, it becomes selected, indicated by a darker background. With control click, you can select multiple modules at once. When you double click a module, it becomes editable with its properties displayed in the properties window.
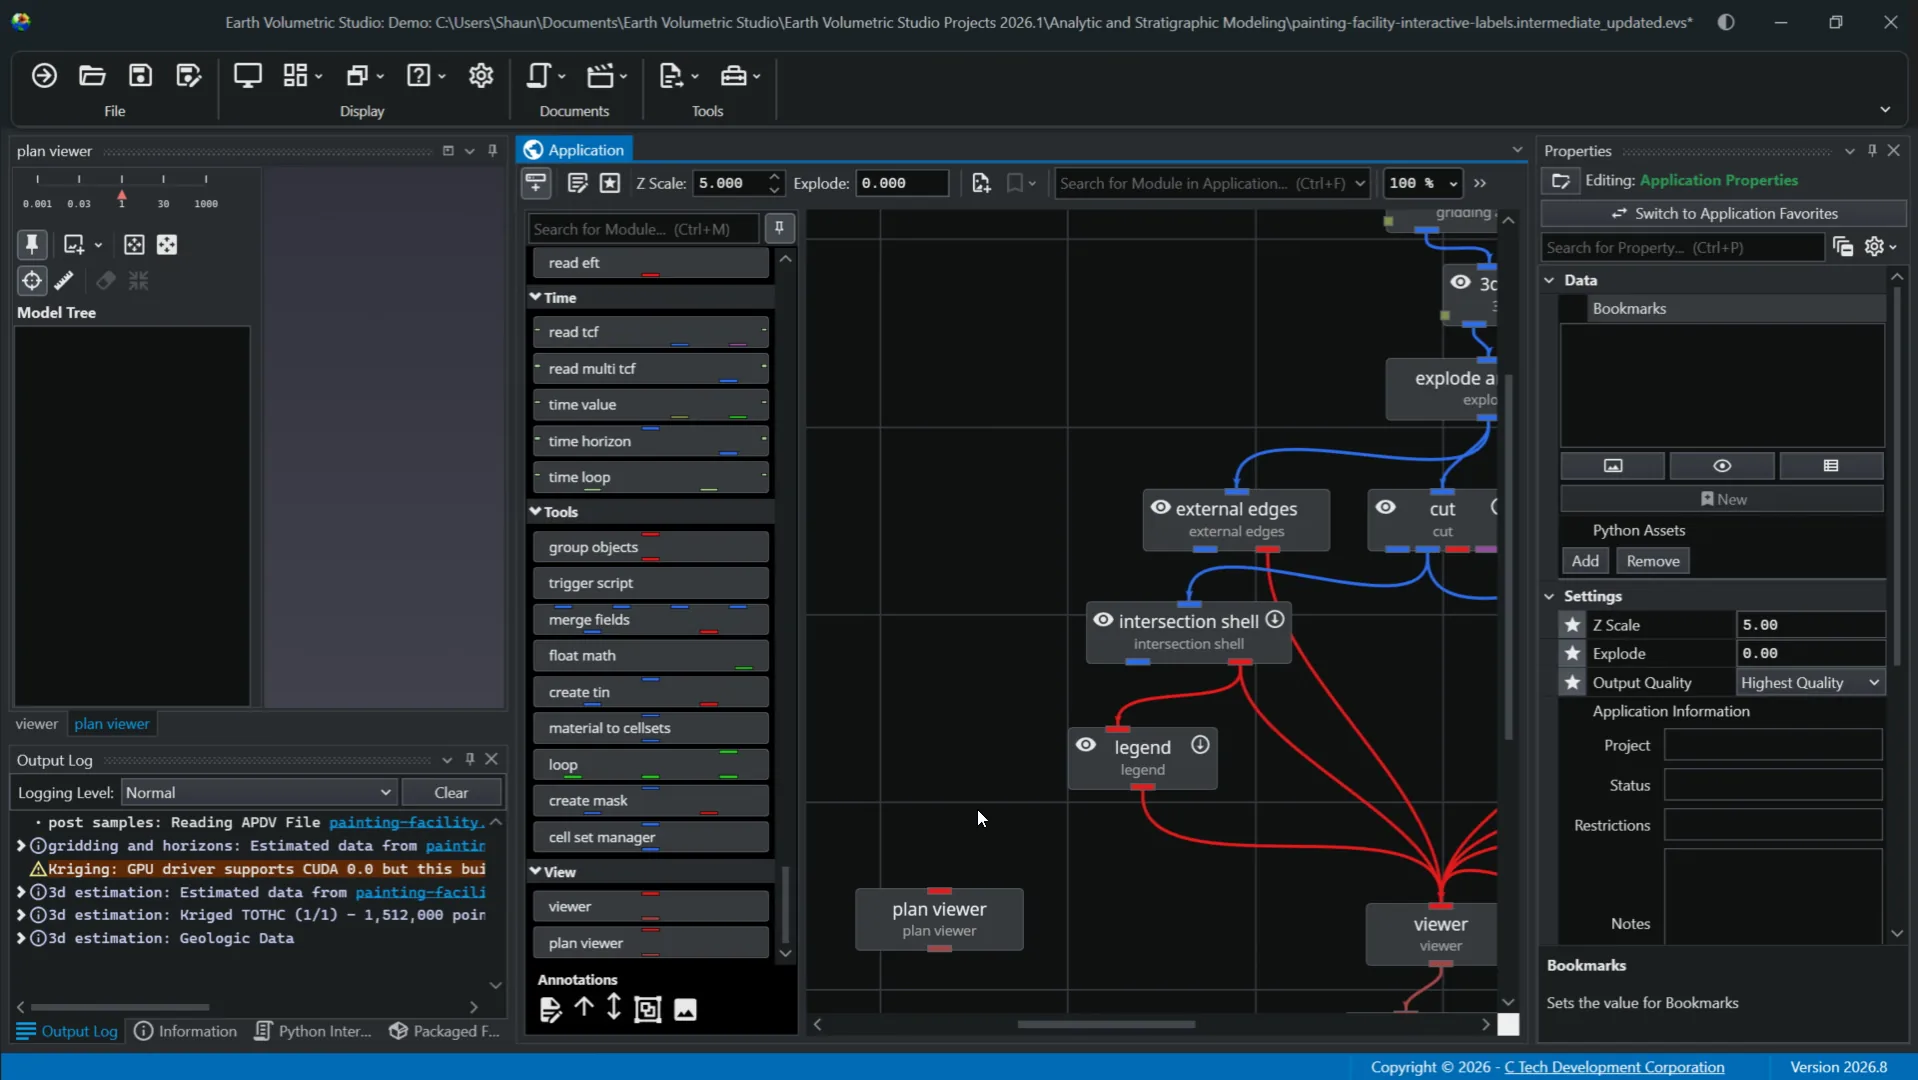
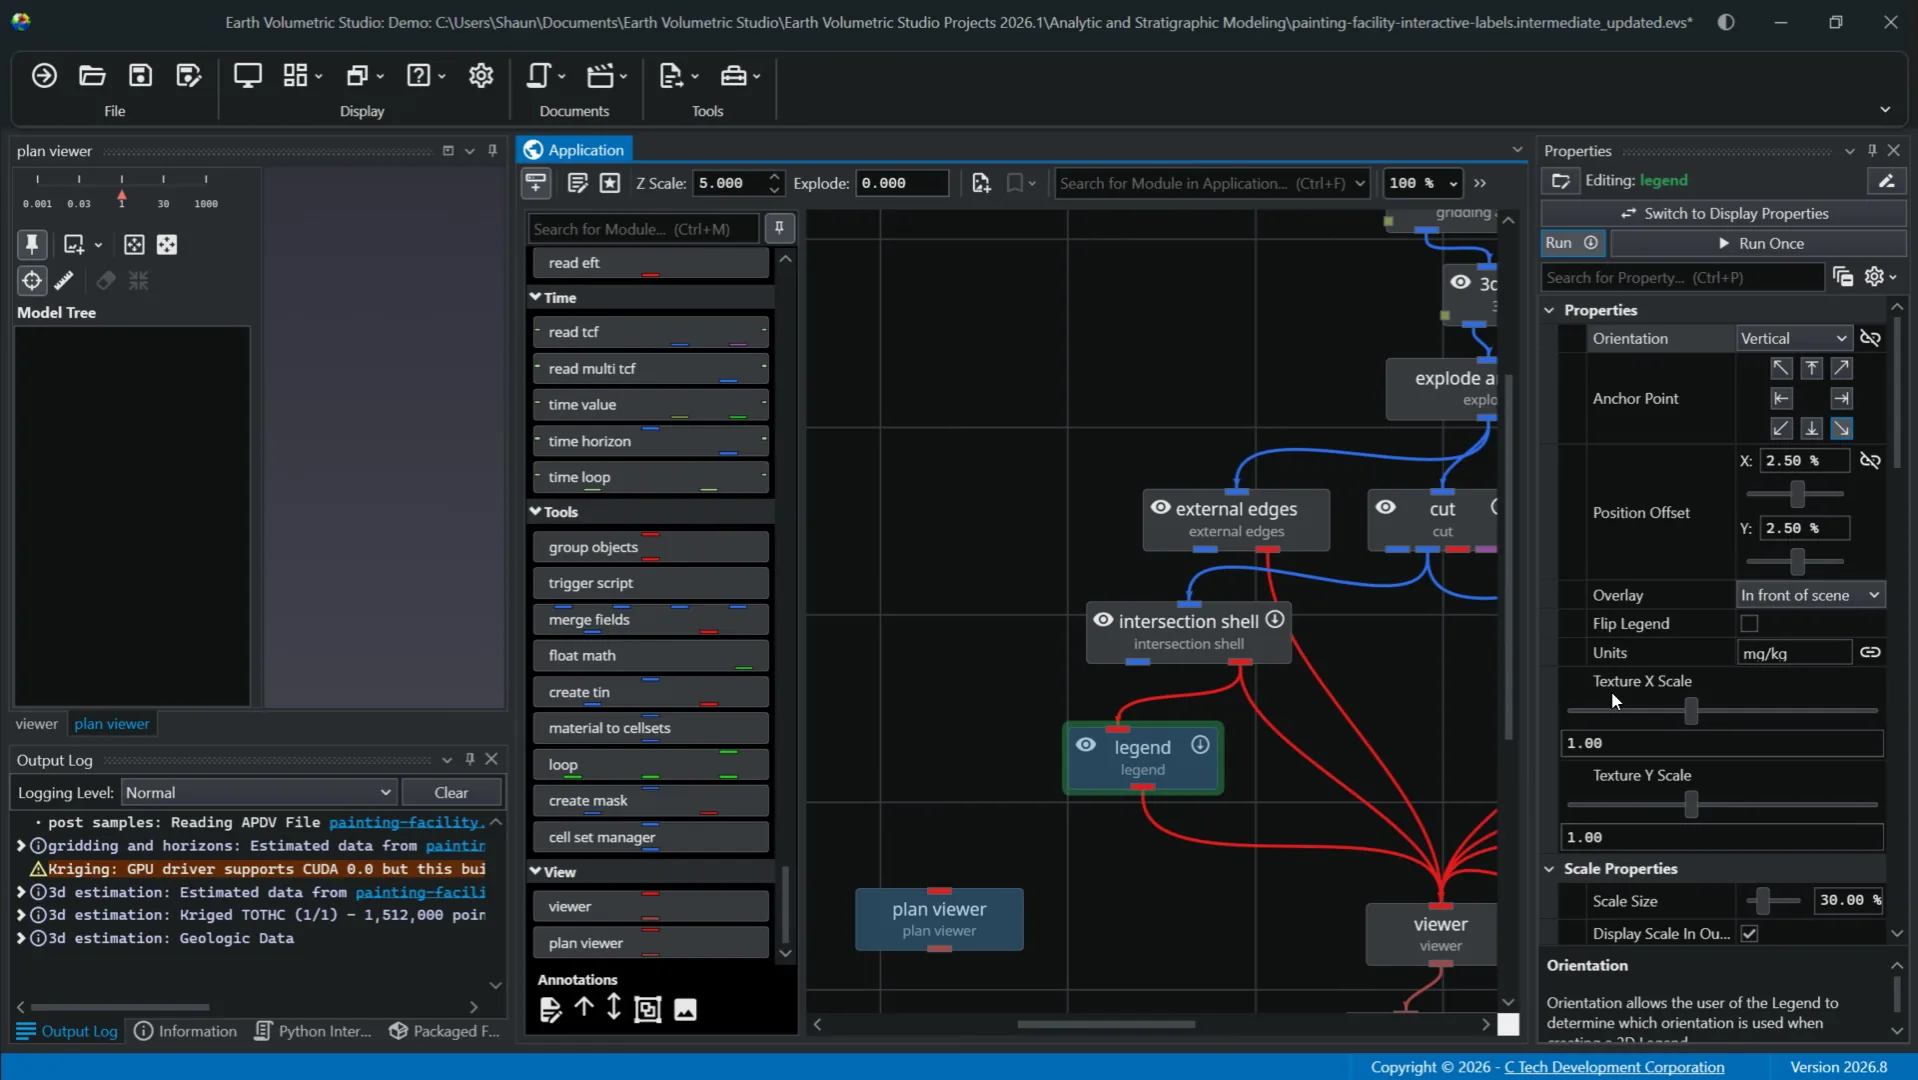
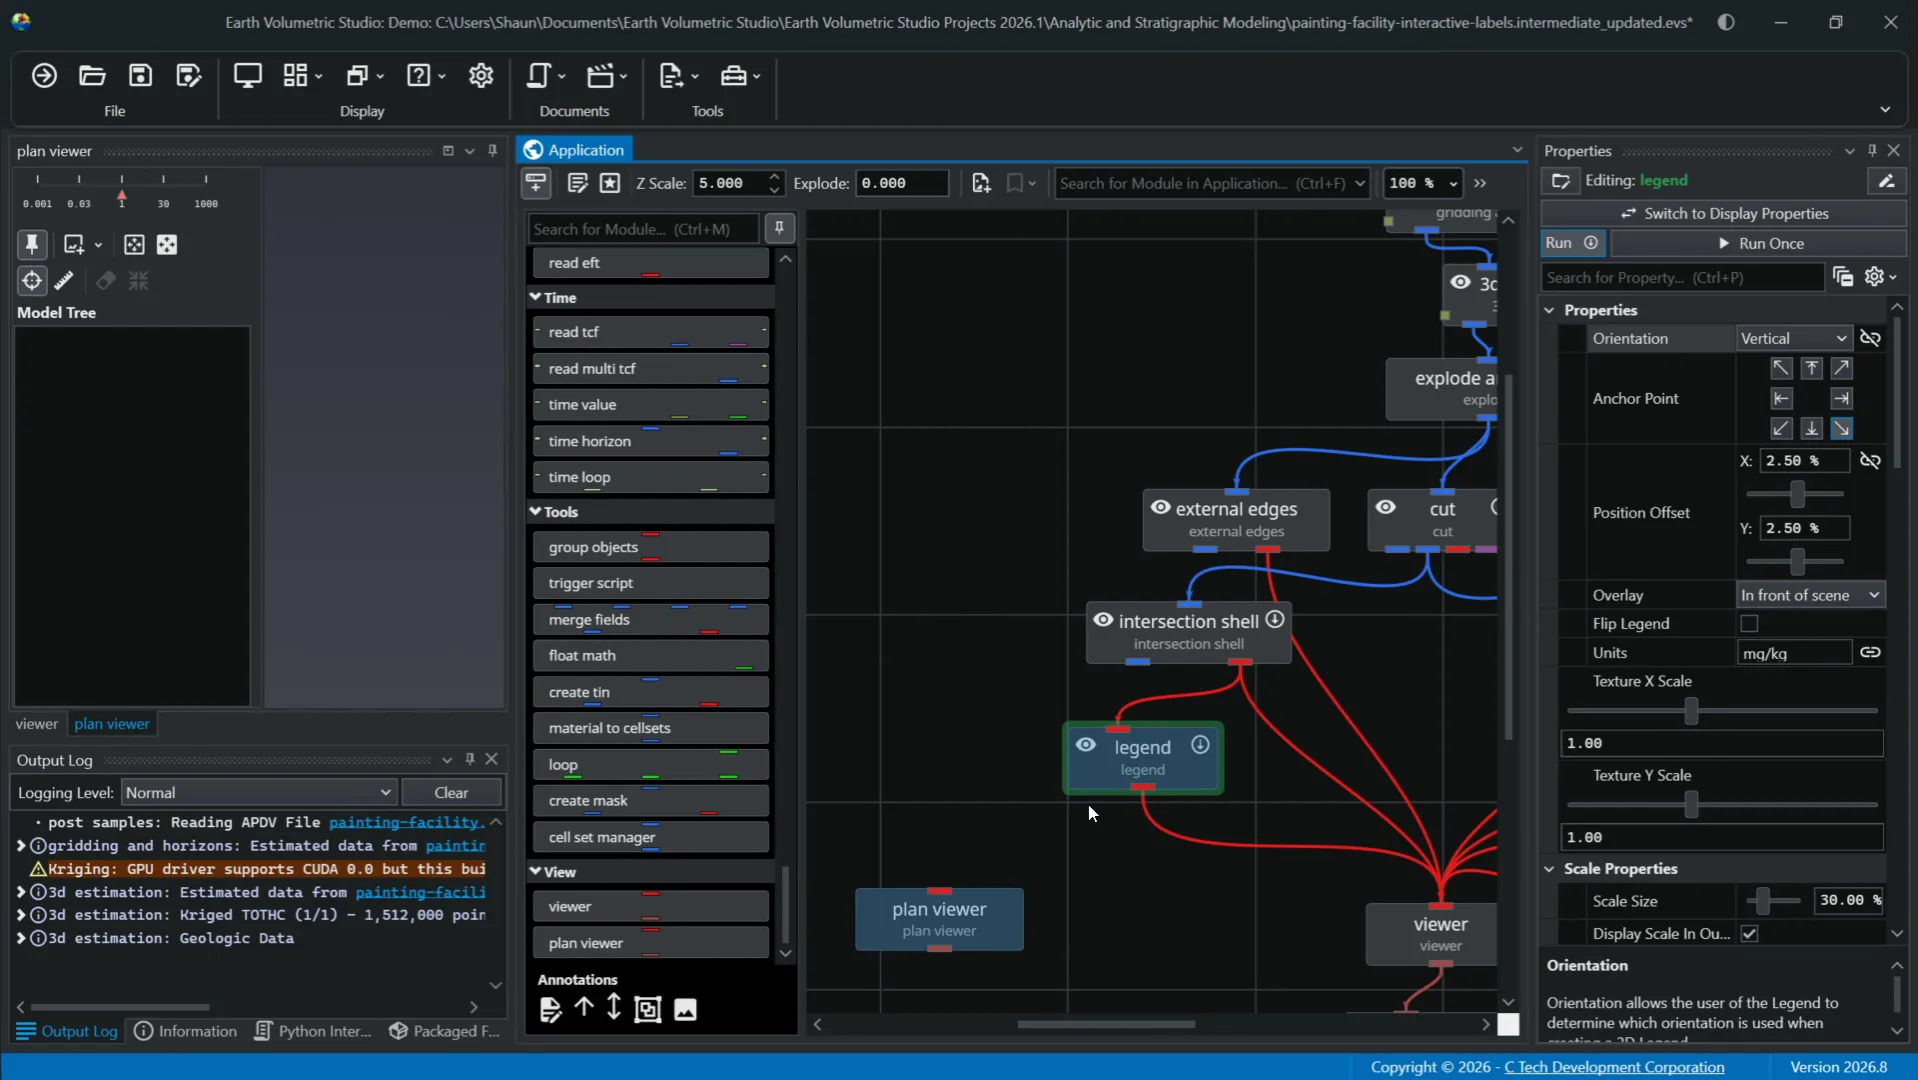
You know when your module is editable when it has a green border around it. There are also visible cues for output status. When a module displays a prominent thick red bar on the bottom, which we don't have in this case, it signifies a "no output" state. This occurs if the module has not yet been executed or if it failed to generate any valid input, giving a clear warning that downstream modules will not receive any data. Conversely, if there is no red bar present, like in our example, that means the module is in a "has output" state and can successfully output data to downstream modules.
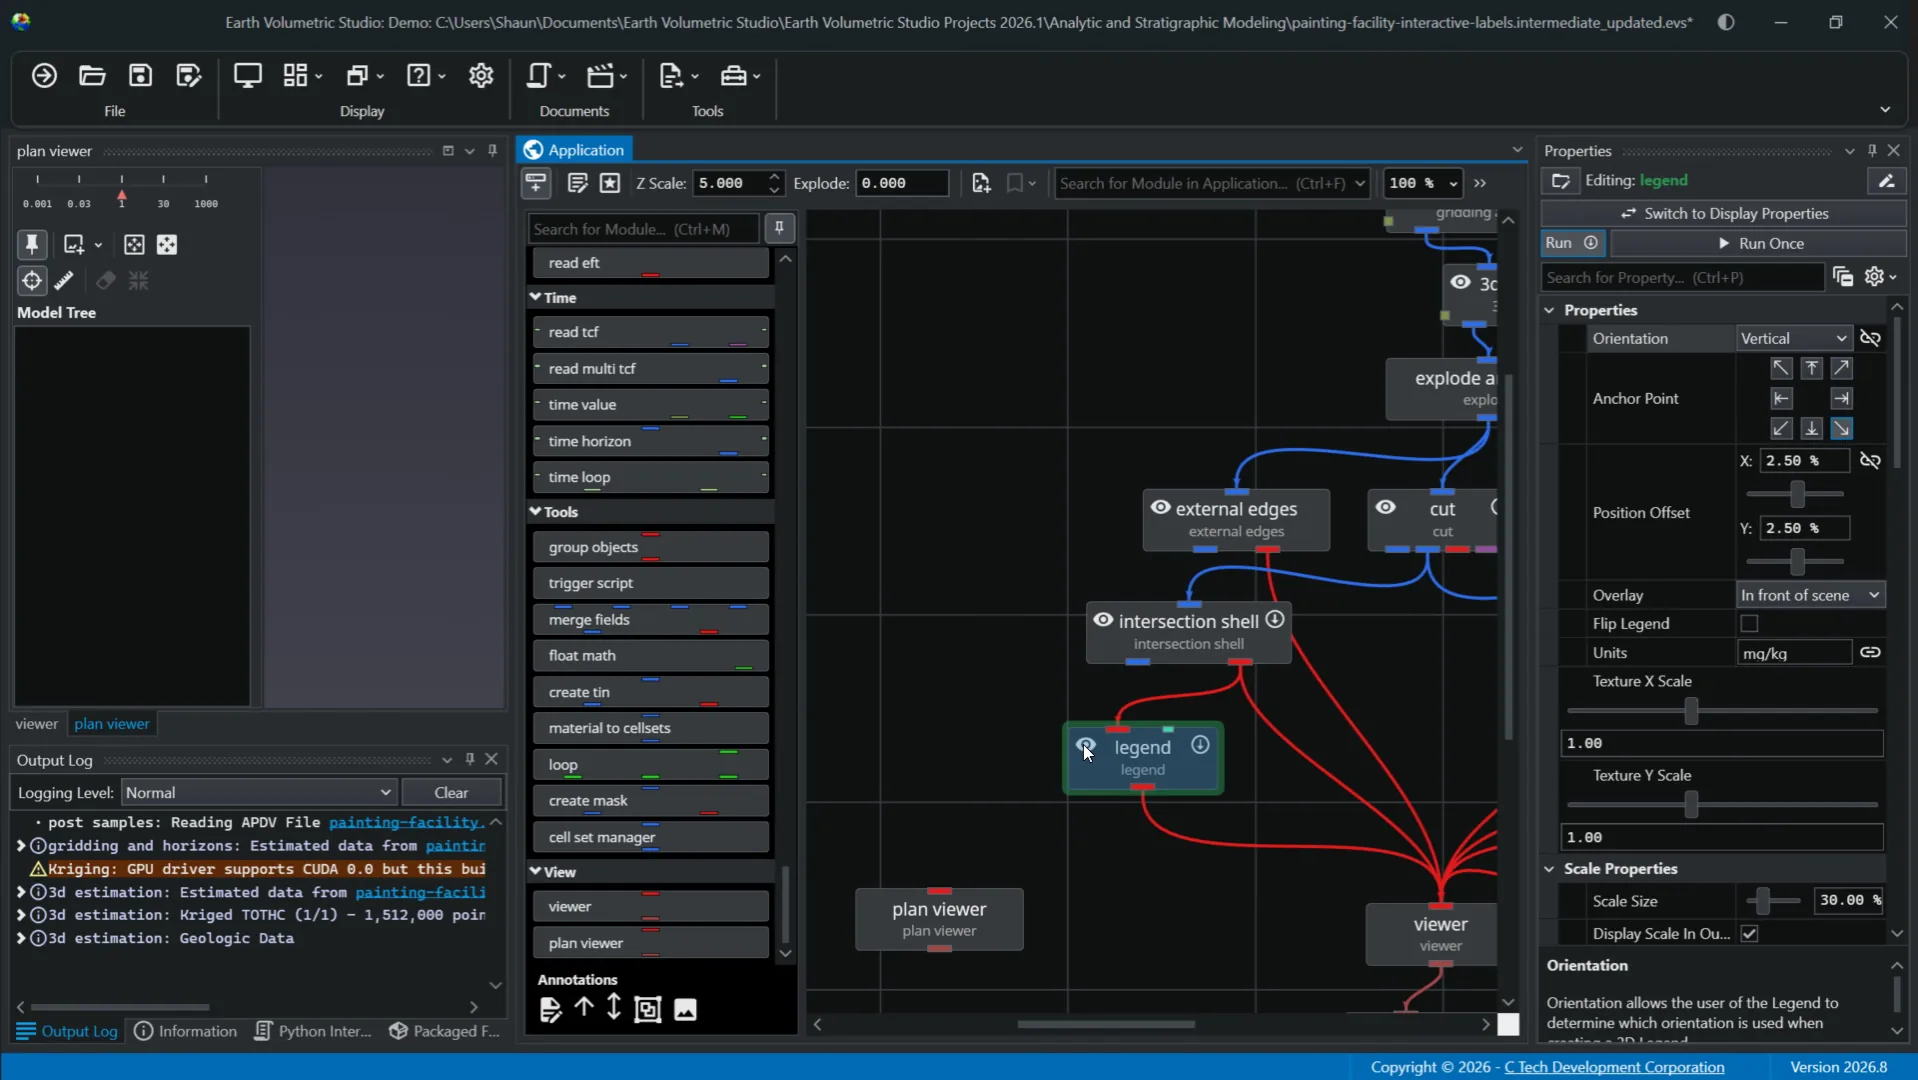
Within the module, you also have execution control. In the upper right, you will see a downward pointing arrow indicating data can flow through the module. This means it will execute automatically whenever its properties change or when it receives new data from an upstream module. The other state you may encounter is a red X in that corner. That indicates the module's automatic execution is turned off. This can always be toggled back on to run. In the left corner is the visibility control. Clicking on the eye icon toggles between visible and invisible. Additional visibility states can be set in Properties.
Lastly, we will touch on using the search tool in the application window. Depending on the sizing of your window, the search feature will be depicted as a magnifying glass on narrower views or a search bar on wider ones. To use the search, you can begin typing the name of the module you want to find and select it from the list to immediately locate it. This can be quite helpful in more complex application networks where trying to manually locate a module on the canvas can be time consuming.
This is an overview of the application window in the EVS environment. Thank you for watching.
This tutorial provided a comprehensive overview of Earth Volumetric Studio's application window, covering key features such as the toolbar, module library, application network, and module management tools. By following these steps, you can efficiently create, connect, and manage modules to build data processing visualization workflows. For further learning, explore advanced properties and workflow customization in additional resources.
Introduction
This tutorial introduces Earth Volumetric Studio's application window. You will learn how to navigate the interface and utilize key features to build effective data processing applications.
1Overview
In the demonstration, we will be looking at EVS's application window as a central workspace for creating and managing your data visualization workflows.
2Toolbar
The application window provides a visual node-based environment where you can build networks by placing and connecting modules to define data flow. The first thing you'll see in the window is a toolbar on top. This provides quick access tools and settings for managing your application.
3Toolbar Features
Options include a toggle for visibility of the module library, edit application properties, and edit application favorites, both of which open in the properties, which we'll focus on more in a dedicated video for that window. There are Z scale and explode manipulation controls with results reflected in the viewer window, create snapshot to save a snapshot of the current state of the application network. The toolbar also has bookmarks functionality, a search bar that we'll go over more a little later, zoom level, and application overview to show a high level view of your application network. This can be useful for large complex applications. You are able to zoom in on a certain part you are working on.
4Options Menu
You also have an options menu containing settings related to connections and the module library. Many of these options let you customize viewing preferences to optimize your workflow. The next thing you'll notice about the application window is it's divided into two main sections, the module library on the left and the application network on the right. We'll look at the module library first.
5Searching the Module Library
The module library is an important component of the application window. It serves as a central repository for all the modules used to build the data visualization and all processing workflows. Unlike other windows, the module library cannot be undocked. It can, however, be hidden when not in use. In the module library, modules are organized into collapsible categories such as estimation, geology, and so forth. This allows you to easily find what you need in your workflow. Additionally, the module library has a search function to quickly filter the list of modules. As you start typing in the search bar, the library will display names of modules that match your specific search query.
6Other Module Library Options
You'll also notice next to the search bar is the pin feature. This button controls the auto-hide behavior of the module library. If you unpin the module library to auto-hide the window, you can always click on the Show Module Library button or use the Ctrl-M keyboard shortcut to reopen that window at any time. Another important feature of the module library is the annotation section at the bottom. These are a set of tools for adding visual annotations to your application network and can help with documenting your workflow, clarifying connections, and organizing complex applications.
7Annotations Features
Let's look at some of the options. First, you can add text annotations. Here you can add notes, titles, or descriptions for different parts of your workflow. Next, we have two line annotation options to draw arrows on the canvas. These can be useful when pointing to specific modules or visually grouping related items that may not be physically close to each other.
8Group and Image Annotations
The group annotation creates a container for a set of modules. You can drag modules inside a group annotation to organize them as a unit. This group can be named, resized, and collapsed to help simplify your view when you have a large complex application network. And lastly, we have the image annotation where you can add an image from a file directly into the application network canvas. This can be quite useful if you plan on adding a logo, diagram, or other visual aids to your workflow documentation.
9The Application Network
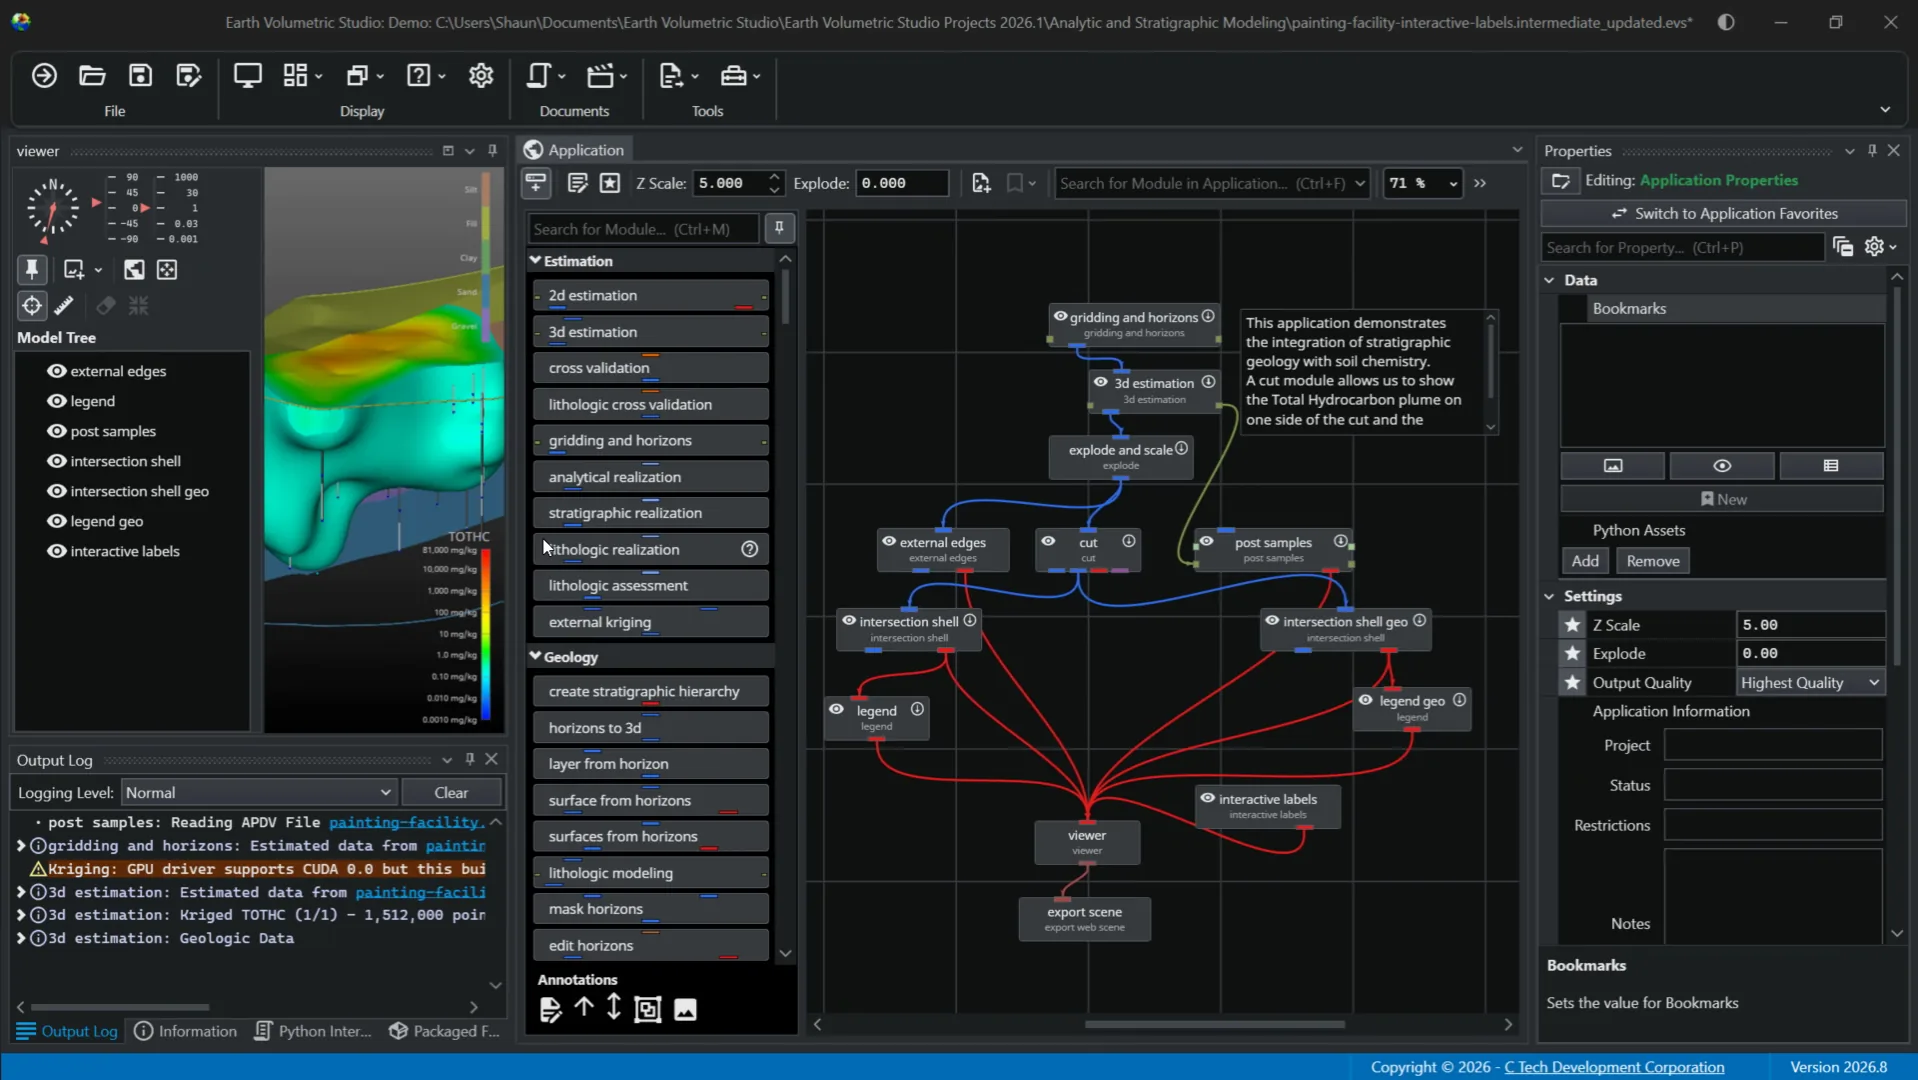
Next, we'll explore the application network side of the window. This is the primary workspace in EVS for building and managing your data processing workflows. On this canvas, you can construct applications by placing and connecting modules to define data flow input to final visualization in the viewer window. First and foremost, modules are the fundamental building blocks of an application. Each one performs a specific task.
10Modules and Ports
These are represented by rectangles like this and have user-defined names and the module type under it. You can easily add modules to your network by dragging them from the module library. The application network also shows how modules communicate with each other through ports. Each module input ports on the top and output ports on the bottom are color coded to indicate the type of data they handle. The two most frequently used ports are renderable object ports, shown in red, and field ports shown in blue. The renderable object ports handle renderable geometry and connect to the viewer window to display objects. This port contains the fields, data, and rendering information necessary for visualization. The blue field port is one of the most common port types used to pass data sets between modules that create, modify, or subset the data. Note there are many port types and subtypes available to use when creating your workflows. A more comprehensive list with color designations can be found in the help documentation.
11Connections
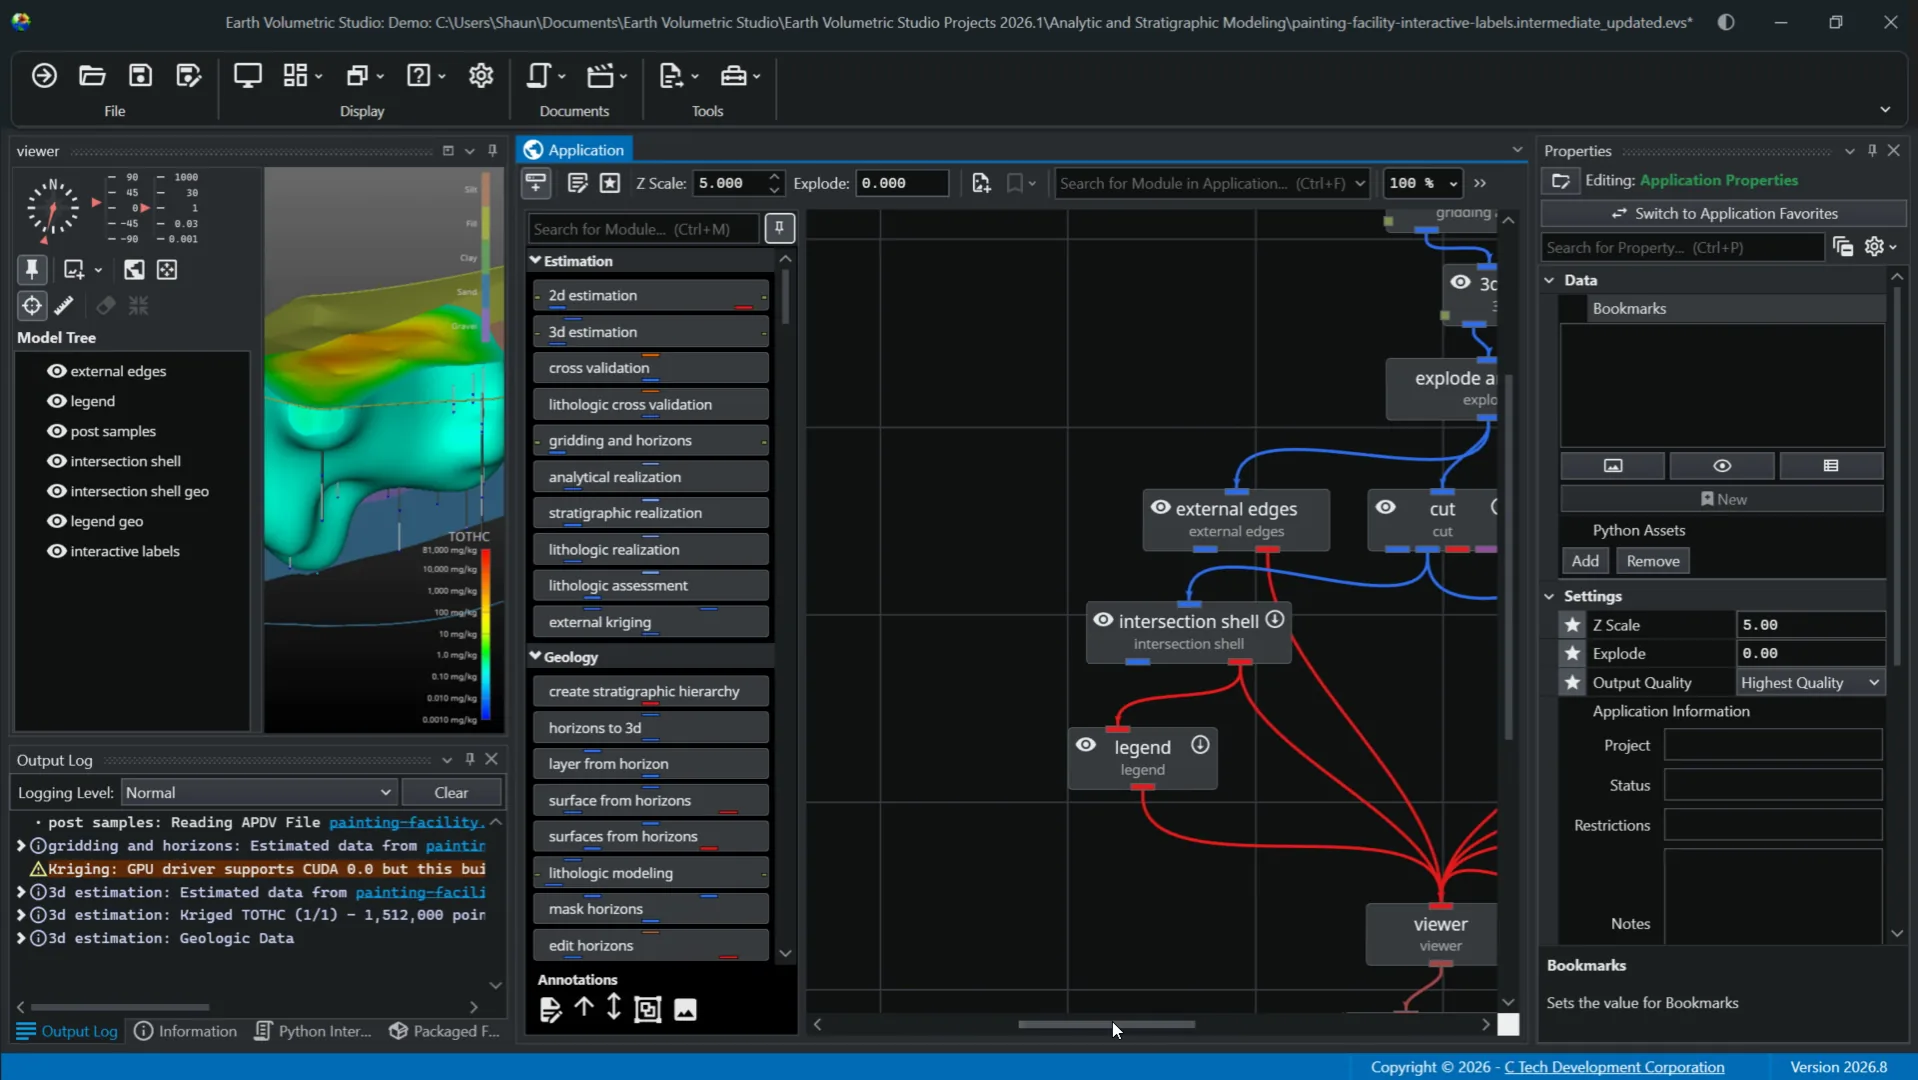
Next, you can create connections between modules to represent the flow of data from an output port of one module to an input port of another. Creating and removing these connections are fundamental to building and modifying your application's workflow. To create a connection, simply use your mouse to drag a line from an output port to your target module. While holding the left mouse button down, you will see all compatible input ports highlighted, indicating where a valid connection can be made. You can then release the mouse button once on the highlighted port of your choosing. To remove a connection, simply move your cursor to the connection you want to remove, click on it, and press the delete key on your keyboard. The connection will be removed if you confirm the warning that pops up. The other method for managing port connections is with the input port and output port context menu. This can be useful for making connections when you have complex applications or modules are far apart, making dragging impractical.
12Connection Context Menu
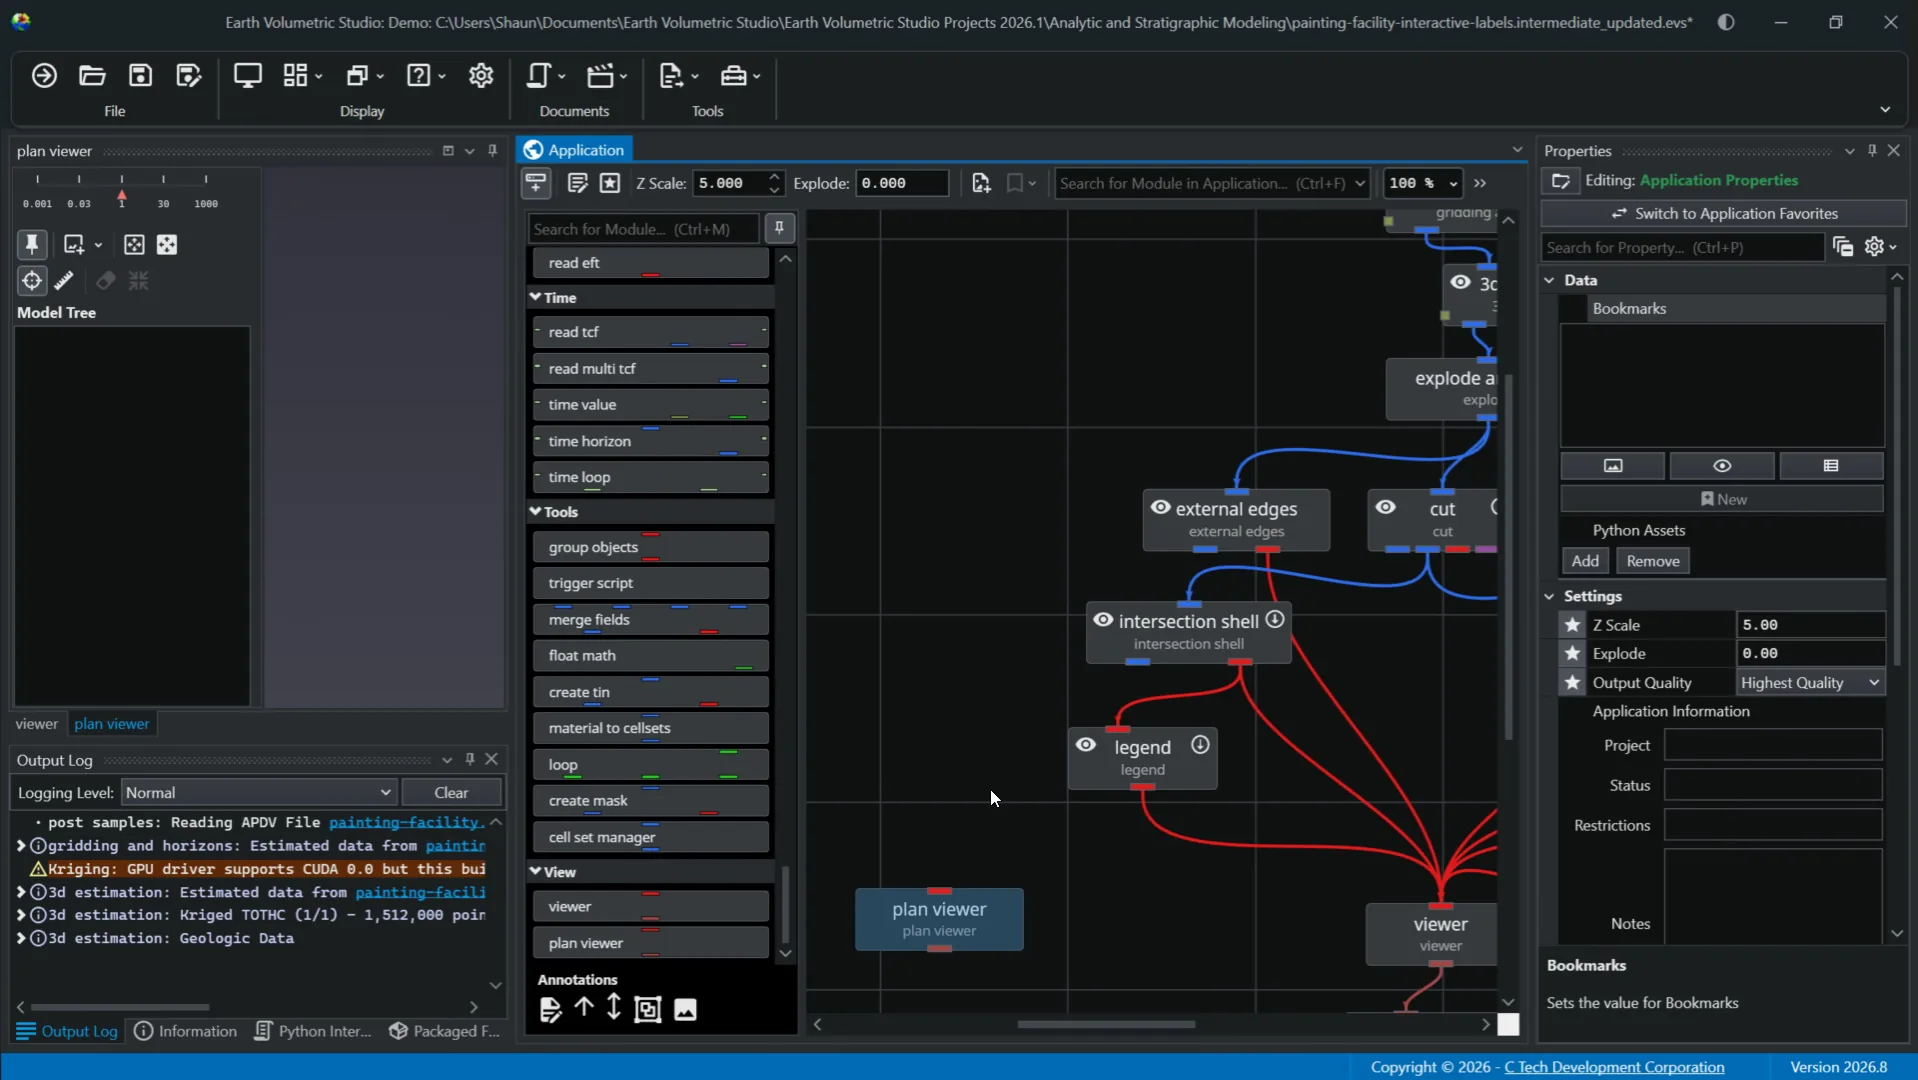
To access this menu, right-click on an input port or output port on the source module you want to connect from. From there you can select the "Connect To" option. This will give you a dialog window that lists all compatible ports available in the application. From here, just choose the target module and port from the list and the connection will be created automatically.
13Right-click Options
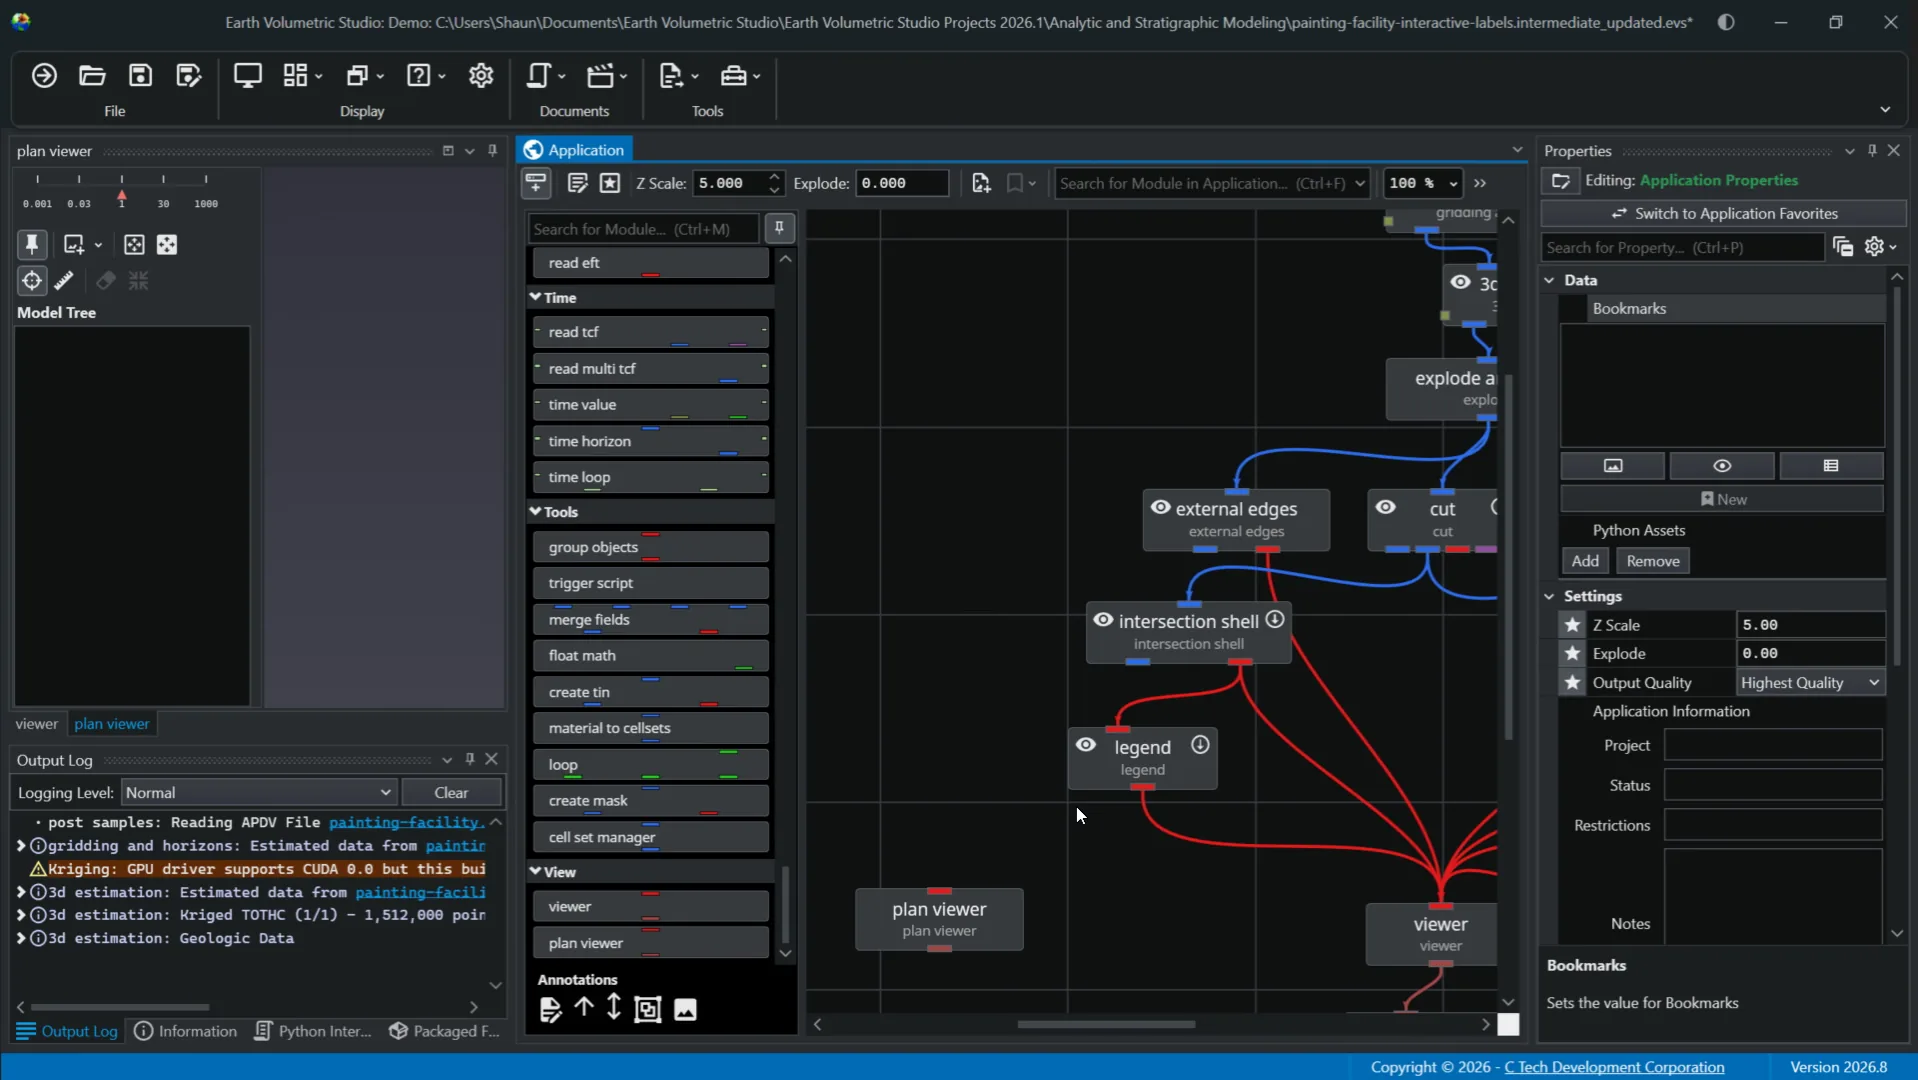
You can also right-click on any port to get additional information such as name, type, subtype, and some connection options. You can disconnect a connection entirely by right-clicking on the connection line itself. Aside from ports and connections, you can right-click on a module to pull up a context menu that provides quick access to several common actions and properties for that module. These include renaming, editing parameters in the properties window, copying the module including its current settings, a visibility toggle, opacity control for the module's visual output in the viewer window, position, or deleting the module altogether.
14Module Statuses
Next, we'll take a look at how modules in the application network display visual cues to indicate their status. These indicators allow for efficient management of your application window by quickly allowing you to understand which module is selected, has run successfully, or set to execute automatically.
15Selecting Modules
For instance, when you single click a module, it becomes selected, indicated by a darker background. With control click, you can select multiple modules at once. When you double click a module, it becomes editable with its properties displayed in the properties window.
16Module Output Status
You know when your module is editable when it has a green border around it. There are also visible cues for output status. When a module displays a prominent thick red bar on the bottom, which we don't have in this case, it signifies a "no output" state. This occurs if the module has not yet been executed or if it failed to generate any valid input, giving a clear warning that downstream modules will not receive any data. Conversely, if there is no red bar present, like in our example, that means the module is in a "has output" state and can successfully output data to downstream modules.
17Execution Control and Visibility
Within the module, you also have execution control. In the upper right, you will see a downward pointing arrow indicating data can flow through the module. This means it will execute automatically whenever its properties change or when it receives new data from an upstream module. The other state you may encounter is a red X in that corner. That indicates the module's automatic execution is turned off. This can always be toggled back on to run. In the left corner is the visibility control. Clicking on the eye icon toggles between visible and invisible. Additional visibility states can be set in Properties.
18Search Tool
Lastly, we will touch on using the search tool in the application window. Depending on the sizing of your window, the search feature will be depicted as a magnifying glass on narrower views or a search bar on wider ones. To use the search, you can begin typing the name of the module you want to find and select it from the list to immediately locate it. This can be quite helpful in more complex application networks where trying to manually locate a module on the canvas can be time consuming.
19Thanks for Watching
This is an overview of the application window in the EVS environment. Thank you for watching.
Summary
This tutorial provided a comprehensive overview of Earth Volumetric Studio's application window, covering key features such as the toolbar, module library, application network, and module management tools. By following these steps, you can efficiently create, connect, and manage modules to build data processing visualization workflows. For further learning, explore advanced properties and workflow customization in additional resources.