Published March 2024
This Tip grew out of a support discussion about grid resolution and the accuracy of stratigraphic horizon surfaces. This is complicated to explain and difficult to completely understand, but the concepts here apply to virtually every stratigraphic model you will build.
Does a Finer Grid Improve Accuracy?
Let me start by saying that if we build a rectangular (rectilinear) grid with 10m cells, where the nodes fall exactly on the 10s, 20s, etc. (233000.0, 233010.0, 233020.0,…) and we use any of our interpolation methods, the elevations we compute at the even 10s will be exactly the same as if we build the same grid with 5 meter cells, adding additional nodes at the centers of each of the original 10m cells.
Does that mean that the 5 meter grid is more accurate?
The only places where the finer grid can be significantly more accurate is where we have noisy data that it can honor. As we move away from the data, we will have relatively smooth surfaces (possible slopes and even convex or concave curves) but the elevations at the middle of the 10 meter cells will be extremely close to the estimated values on our 5 meter grid. Only the addition of random, noisy data in areas will create a surface that has complexity which allows the finer grid to honor the data better.
The question I ask myself is if we see patterns of small hills and valleys, with varying distances (frequencies) of these bumps, should our estimation method try to simulate these bumps as we move further from the data? The answer to this question is absolutely not.
We cannot know how the distances between this random surface structure will change. If we add these bumps, we are likely to put a bump where there should be a valley and a valley where there should be a bump. This could double or quadruple our errors and create a much poorer model. As we move away from measured data we want an estimate that will create a surface that will be the average of the bumpy surface, passing through the middle of the hills and valleys.
You might ask whether we could instead build a grid where all surfaces are adaptively gridded using the X-Y coordinates of all horizons. This is not impossible, but it is much more complicated, and as discussed above, it doesn’t likely help that much.
Two Kinds of Accuracy
We need to acknowledge that there are two “accuracy” issues involved:
- The accuracy of the gridded surface in matching the measured data values. Adaptive gridding can provide a surface which exactly matches the data at the measured X-Y locations.
- The accuracy of estimated surfaces in matching actual horizon elevations everywhere else. I believe this is more important to understand. If the layer thicknesses which affect (for example) piling installations are important, and those pilings will not be exactly where you measured elevations, this is what really matters.
The accuracy to which C Tech’s estimated surfaces will actually match the real horizons depends on the nature of the surface and the amount and distribution of actual measurements:
- The more data that is collected, the better the surface is defined.
- The smoother and more well behaved the surfaces are, the less data is needed.
- Surfaces with quickly changing slopes will need more data.
- Finer gridded surfaces can provide closer matches at the measured locations.
- Adaptively gridded surfaces can provide exact matches at the measured locations.
Stratigraphic Realizations
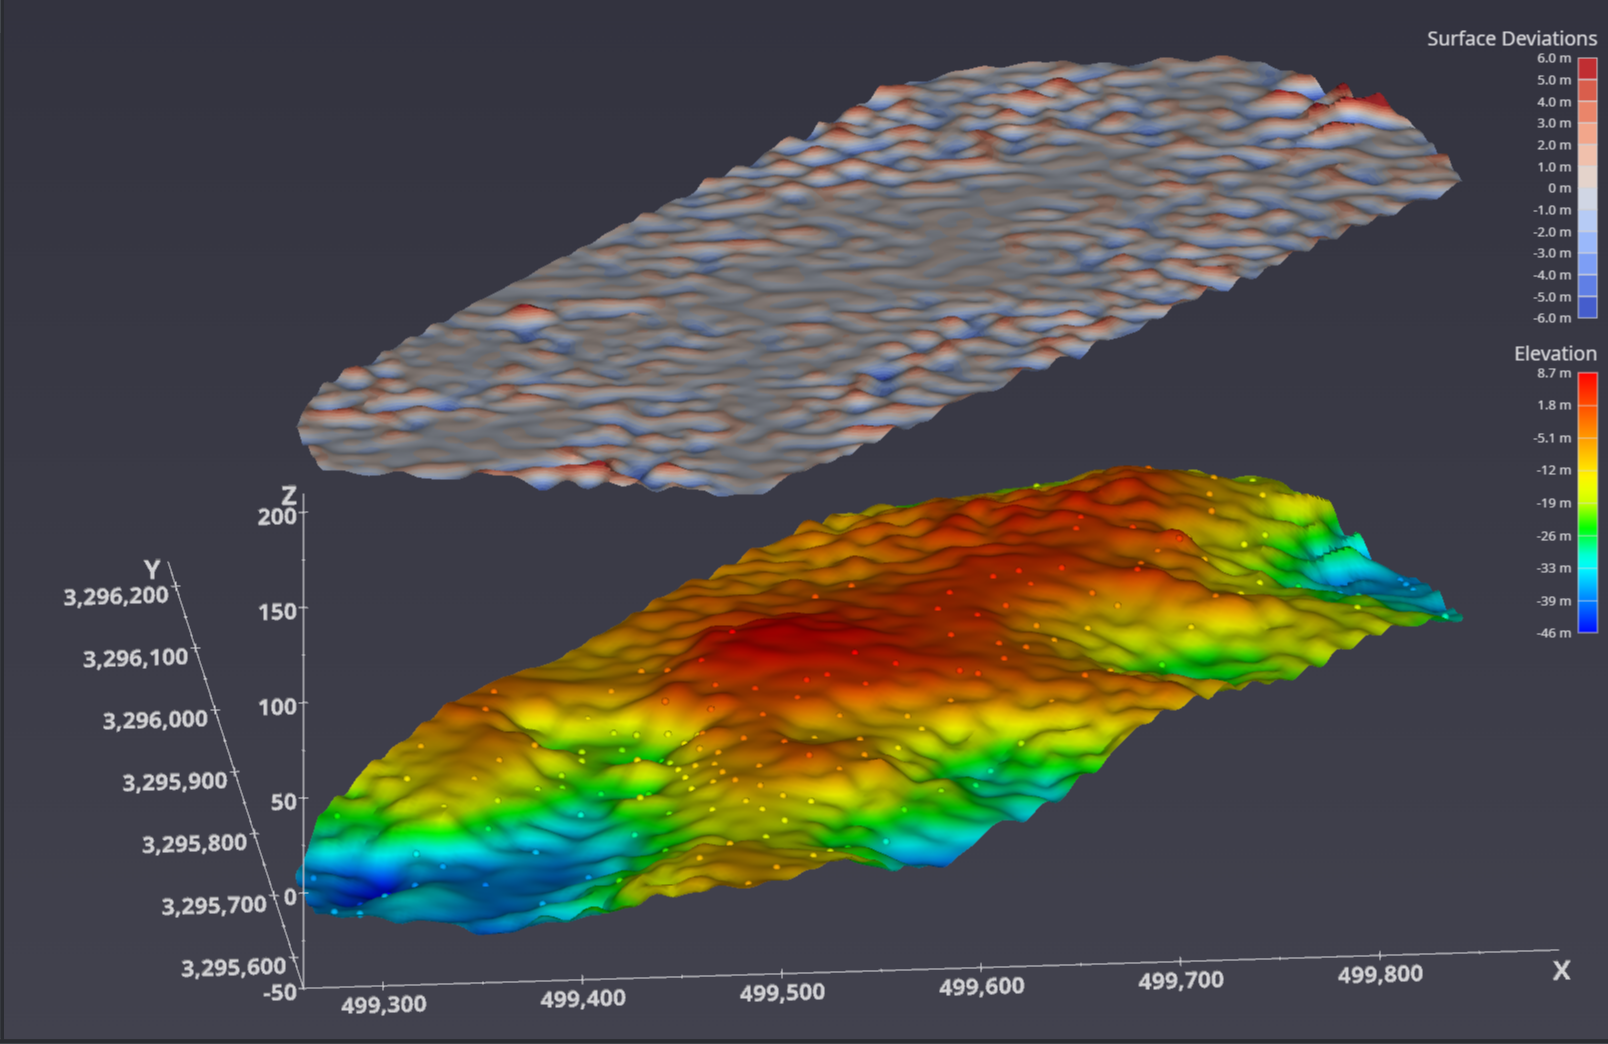
C Tech’s stratigraphic realization module provides a way to see possible scenarios (realizations) of what might exist in the real world. It uses the nominal estimated surface and computed standard deviations to create one possible “synthetic” horizon based upon two fundamental statistical parameters:
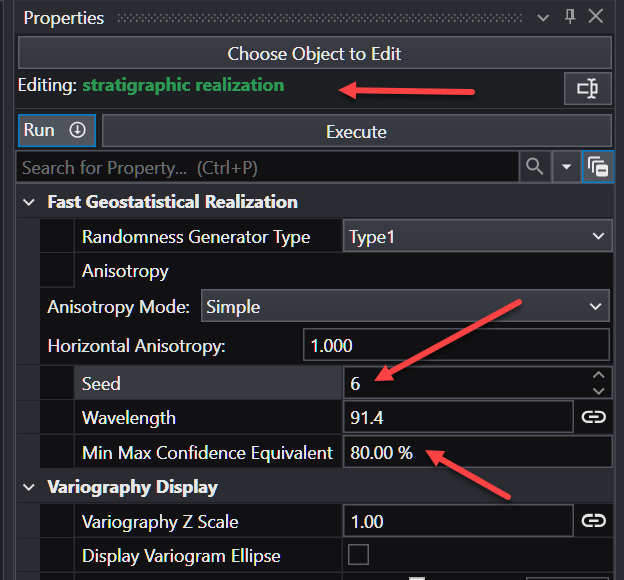
- A random number generator Seed
- The Confidence level you wish to have. A higher Confidence will generate greater deviations, but there will be a greater chance that the actual real-world deviations will not be greater than the realizations.
Once we have this Horizon Realization, we can compute how much it “deviates” from the nominal surface estimate. These deviations help to quantify the potential inaccuracies that might be encountered because of the nature of the actual horizon and the quantity and distribution of measured data.
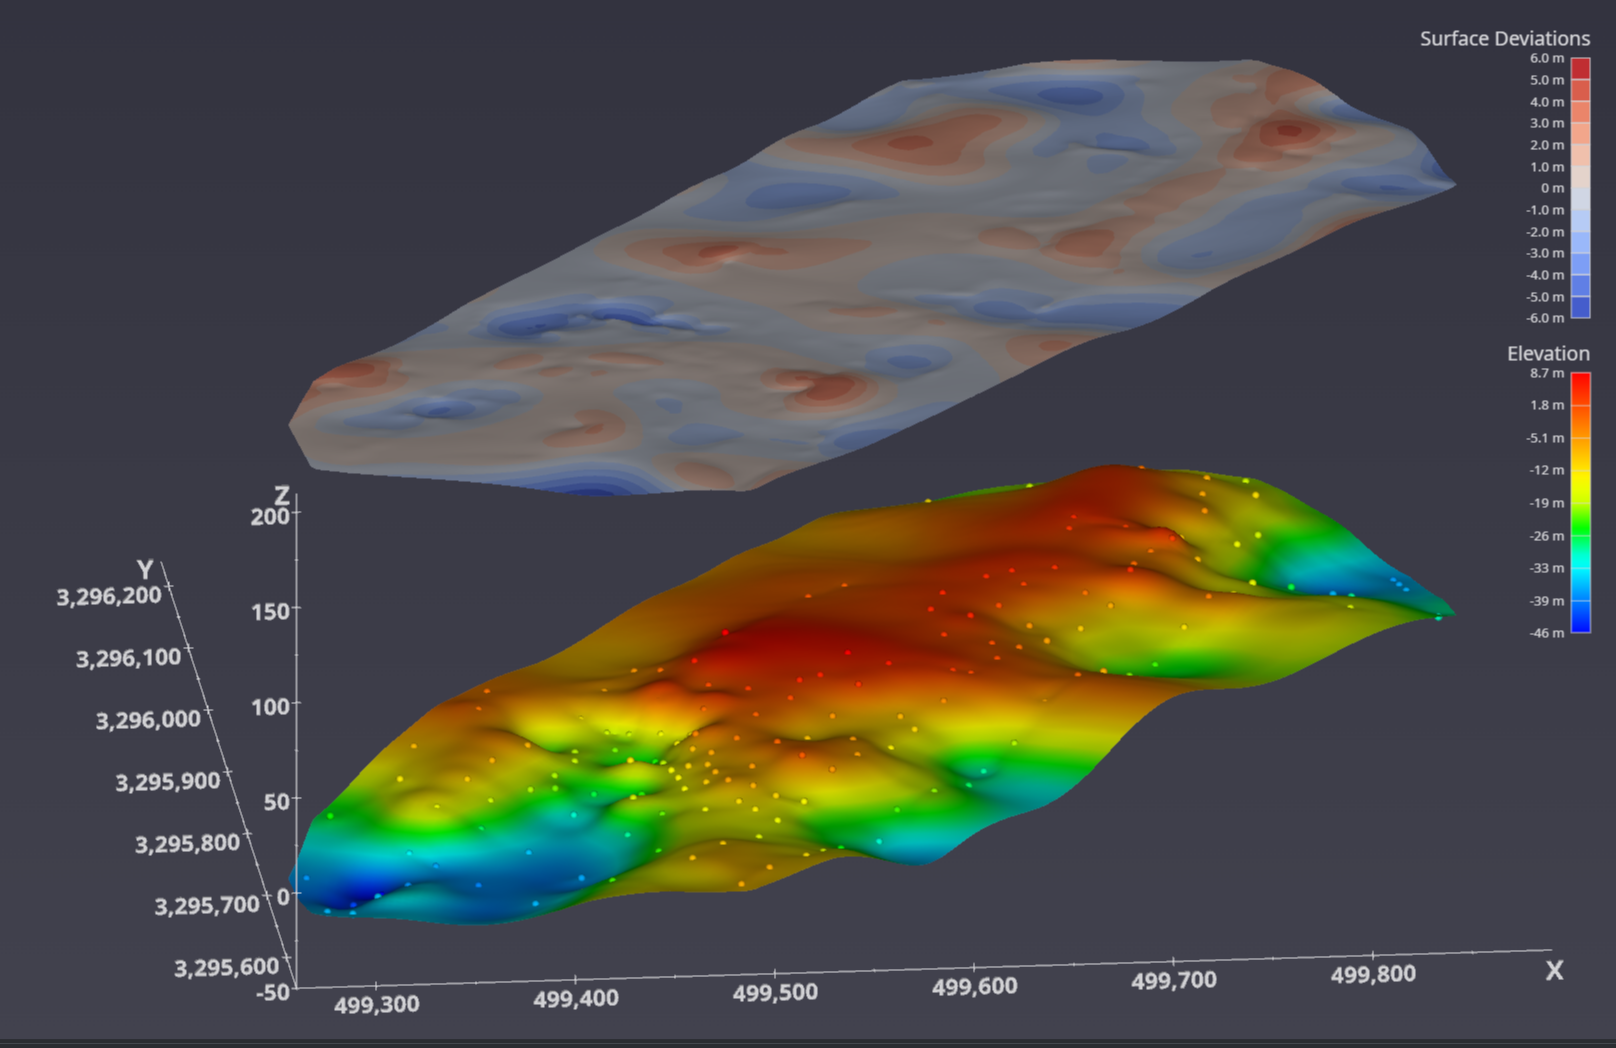
Your customer must understand that there is no perfectly correct (right) answer.
You also might want to investigate the Wavelength parameter to see that the deviations might be high frequency or low frequency. For this dataset a wavelength of 15-20 is interesting because it is similar to the localized surface “bumps” caused by closely spaced samples that vary wildly in elevation.