Modules in the Application Network display several visual cues to indicate their current status. These indicators help you quickly understand which module is selected, which is being edited, whether a module has run successfully, and if it is set to execute automatically. This allows for efficient management of your application’s workflow.
Selection and Editing Status
The border of a module changes color to reflect its selection and editing state.
| Status | Description |
|---|---|
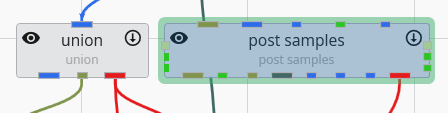
| Selected Module (Darker Background) | When you single-click a module, it becomes selected, indicated by a darker background. You can select multiple modules at once (e.g., by holding Ctrl or Shift), and all will show this background. |
| |
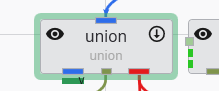
| Editable Module (Green Border) | When you double-click a module, it becomes the single “editable” module, and its properties are displayed in the Properties window. This state is indicated by a thick green border. There can only be one editable module at a time. |
| |
| Editable Port | If you double-click on a specific output port of a module, that port’s properties will be shown in the Properties window. The parent module will receive the green “editable” border to indicate it is the focus of the properties window. |
|
Output Status
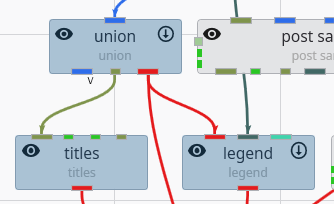
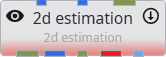
A key indicator of a module’s state is the presence or absence of a solid red bar along its bottom edge. This simple visual cue instantly tells you whether a module has successfully run and produced data that is available to downstream modules.
| Status | Description |
|---|---|
| No Output (Red Bar Visible) | When a module displays a prominent red bar, it signifies a “No Output” state. This occurs if the module has not yet been executed or if it failed to generate any valid output. The red bar serves as a clear warning that downstream modules will not receive any data. |
| |
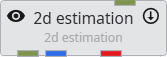
| Has Output (No Red Bar) | When the red bar is absent, it indicates a “Has Output” state. This confirms that the module has run successfully and its output data is ready and available for downstream modules. |
|
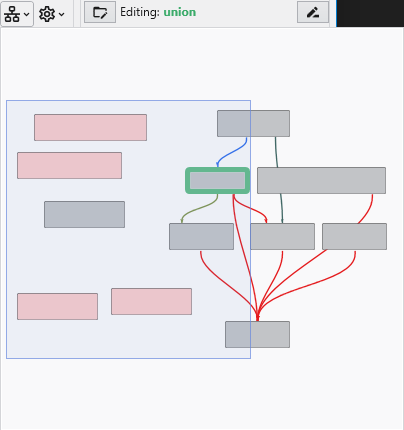
Status in the Application Overview
The Application Overview window also provides a simplified summary of module statuses, which is useful for monitoring complex applications. In the overview, you can still see which module is selected for editing (highlighted in green) and which modules have successfully run (those without the red “No Output” bar).