Create both 2D and 3D lines interactively with the mouse.
Accepts a 3D polyline and can either increase or decrease the number of line segments of the polyline, as well as smooth or spline the polyline.
Converts a closed polyline into a triangulated surface.
Clean, break up cells, and flip normals on an input surface.
Produce open or closed tubes of constant or data dependent radius using 3D lines or polylines as input.
Produce a volumetric extrusion along a line.
Produce open or closed tubes of user defined cross-section and constant or data dependent radius using 3D lines or polylines as input for the center line and a single 2D polyline as the cross-section of the tubes.
Accepts surfaces, lines, or points and adds one to the dimensionality of the input by extruding the mesh in the Z direction.
Provides a way to move any object along multiple paths to create a 'driving' animation.
Place a single scalable geometric object (glyph) at an interactively determined location.
Place geometric objects (glyphs) at all nodal locations of a field.
Place geometric objects (glyphs) at all cell centers of a field.
Create a 3D grid aligned to a specified strike and dip.
Create a 2D or 3D uniform grid.
Subsections of Geometry
draw lines
The draw lines module enables you to create both 2D and 3D lines interactively with the mouse.
The mouse gesture for line creation is: depress the Ctrl key and then click the left mouse button on any pickable object in the viewer. The first click establishes the beginning point of the line segment and the second click establishes each successive point.
draw lines allows adding of points that are outside the model extents, undoing of the last picked point, and the clearing of all picked points. Unlike most modules which create mesh data to be used by other modules, the draw lines module receives input from the viewer, and also passes on field data to be used by other modules.
There are two drawing modes:
Top View Mode creates 2D lines which are always at Z=0.0. You must be in a Top View to draw with this mode, but you may pick points anywhere in the viewer screen.
Object Mode creates 3D lines which are drawn by probing objects in your model. You cannot draw at a point without having an object there or specifying a coordinate using the x-y-z type-ins.
NOTE: Because draw lines saves your lines with your application, when an application is saved, the purple port is automatically disconnected from the viewer. This ensures that when you load an application the resulting objects (lines, fence-diagrams, etc.) will look exactly the same as when you saved the application. However, if you wish to draw new lines you will need to reconnect the purple port from the viewer.
Ports
| Direction | Name | Type | Description |
|---|---|---|---|
| Output | Output Field | Field | A field containing the created lines. |
| Output | Output Glyphs | Field | A field containing the created glyphs. |
| Output | SampleData | Renderable | A renderable object displaying the lines. |
Properties
| Property | Type | Description |
|---|---|---|
| Probe Action | Choice: None, Reset Position, Add Point | Allows for the changing of the current line coordinates or for adding new coordinates at the probed location. |
| Drawing Style | Choice: Top View Mode, Object Mode | The Drawing Style allows the user to select coordinates using two different methods. In Top View Mode: the Viewer must be in Top View; any point in the Viewer can be selected; and the Z coordinate is the Z Top value. In Object Mode: the Viewer can be in any rotation; and only probing on objects will give coordinates. |
| Z Scale | Double | The Z Scale is the vertical exaggeration that has been applied to the input of the module. |
| Z Top | Double | The Z Top value is the z value used when creating lines in Top View Mode. |
| Coordinate Units | String | The coordinate units control for draw lines has different behavior than other linked controls. The first time a point is created the control will unlink and check the coordinate units of additional points against the set units. |
| Display Lines | Boolean | The Display Lines toggle will turn off visibility of the created lines. |
| Display Glyphs | Boolean | The Display Glyphs toggle will turn off visibility of the created glyphs. |
| Line List | String | The list of lines and their coordinates created so far. Selecting the Closed toggle will cause a line segment from the last point added to the first point to be created. |
| Current Line | String | The Current Line is the line selected from the Lines list. |
| ELF File Name | String | Output the created lines as an ELF file. |
Glyph Settings
| Property | Type | Description |
|---|---|---|
| Generated Glyph | Choice: Sphere, Cube, Cone, Cylinder, Polygon, Disk, Point | The Generated Glyph choice allows the user to select the type of glyph that is automatically generated. |
| Glyph Size | Double | The Glyph Size value is used to scale the glyphs in all directions. The default is automatically computed based on your input data. |
| Sphere Subdivisions | Integer | The number of subdivisions to use for spheres. Larger numbers create more detailed sphere representations. |
| Glyph Resolution | Integer | The resolution for generated cone, polygon, cylinder, and disk glyphs. |
| Primary Axis Factor | Double | The scale factor for the primary axis of the glyph. |
| Secondary Axis Factor | Double | The scale factor for the secondary axis of the glyph. |
| Heading Dip | Double | The Heading and Dip values are used to align the glyphs to a constant orientation. |
| Roll | Double | The roll of the glyph along its primary axis. |
| Include Center Data | Boolean | The Include Center Data toggle will tell the module to include the center point of each glyph as a cell data component. This allows the user to probe onto the glyph and return its center instead of the position on the outside of the glyph. |
polyline processing
The polyline processing module accepts a 3D polyline and can either increase or decrease the number of line segments of the polyline. A splining algorithm smooths the line trajectory once the number of points are specified. This module is useful for applications such as a fly over application (along a polyline path drawn by the user). If the user drawn line is jagged with erratically spaced line segments, polyline processing smooths the path and creates evenly spaced line segments along the path.
Ports
| Direction | Name | Type | Description |
|---|---|---|---|
| Input | Input Field | Field | The line field to use for splining or smoothing. |
| Output | Output Data | Field | A line field containing the smoothed or splined line. |
| Output | Output Object | Renderable | A renderable object displaying the sample data. |
Properties
| Property | Type | Description |
|---|---|---|
| Z Scale | Double | Vertical scaling for writing lines. |
| Specification Method | Choice: Number Of Points, Path Step Size | The output line segment size can be adjusted via two options. Number of Points mode allows line smoothing adjustments by specifying the number of line segments. Path Step Size mode allows smoothing adjustments by specifying the step size in the units of the input mesh. |
| Number Of Points | Integer | If the Specification Method is set to Number Of Points, the total number of points in the path can be set using this control. |
| Path Step Size | Double | If the Specification Method is set to Path Step Size, the length of each path step in the units of the input mesh. |
| Max Path Step Count | Integer | The max number of lines to create using the Path Step Size specification method. |
| Resample At End | Boolean | If the Resample At End toggle is ON, the line is segmented before and after being smoothed or splined. |
| Tolerance | Double | The Tolerance parameter determines how close two disjoint points must be before the two polylines are merged. |
| Sampling Method | Choice: Spline, Smooth, Preserve Nodes | The Sampling Method allows the user to change how the polyline is created. Spline connects each point with a path determined by the gradient of the points. Smooth keeps to the original path with sharp corners smoothed using the Smoothing Percentage. Preserve Nodes keeps the same path as the input but breaks the path into smaller segments. |
| Smoothing Order | Integer | The Smoothing Order determines the number of points to be used for splining. More points creates a smoother line that departs more from the original. |
| Smoothing Percentage | Double | The Smoothing Percentage determines the degree of smoothing. Higher values creates a smoother line that departs more from the original. |
| Smoothing Iterations | Integer | The Smoothing Iterations is analogous to multiple polyline processing modules connected in series. This provides a means to further smooth erratic lines while staying close to the original points. |
| Translate Export By Origin | Boolean | The Translate Export by Origin toggle will cause the output to be written in the user’s coordinate space. When this is turned off the output will be written around the origin. |
| ELF Filename | String | This button allows the user to output the created polyline as an ELF file. |
triangulate polygons
The triangulate polygons module converts a closed polyline into a triangulated surface. This surface can be extruded or used by the distance to 2d area module to perform areal subsetting of 3D models.
Polylines with WIDTH in AutoCAD DWG files are converted by import cad into triangle strips of the specified width. As you zoom in on polylines with width, the apparent width will change, whereas the apparent width of lines does not change. However, once they are triangles, they do not define a closed area and therefore would not work with triangulate polygons.
Ports
| Direction | Name | Type | Description |
|---|---|---|---|
| Input | Input Field | Field | The line field to use for triangulating. |
| Output | Output Field | Field | The triangulated field. |
| Output | Output Object | Renderable | A renderable object to display. |
Properties
| Property | Type | Description |
|---|---|---|
| Tolerance | Double | The Tolerance control allows the user to set the distance between points for closing a polygon. |
triangle refinement
The triangle refinement module is primarily for use with distance to surface. It can subdivide triangular and quadrilateral cells until none of the sides of the output triangles exceed a user specified length (a default value is calculated as 5% of the x-y extent of your input surface). This increases the accuracy of distance to surface especially when the input surface comes from create tin and the nodes used to create the TIN are poorly spaced. It can also correct the normals of a surface. It does this by organizing all of the triangles and quadrilaterals in a surface into disjoint patches, and then allowing the user to select which patches have normals that need to be flipped. The maximum number of triangles in a patch is 130,000; any triangles above this number will be considered to be in the next patch.
Removing small cells is used to remove extremely small cells (based on area in your coordinate units squared) that sometimes are generated with CAD triangulation routines that might have their normal vectors reversed and would contribute to poor cutting surface definition. Try this option if you find that distance to surface is giving anomalous results.
The ability to fix normals is used to check that all of the triangles in selected patches of the surface have the same normal vector direction. If the normal is backwards, you can flip the normal of the patch in two ways. The first way is Alt + Right click on a cell in the patch that you wish to flip and then click the Add patch to flip list button. You only need to do this for one cell in each patch. Another way to do this is to set the Cell ID and Cell Data value of a cell in the patch you wish to flip. The Cell Id and Cell Data values must be obtained from the surface being output from triangle refinement, and not the surface being input.
Ports
| Direction | Name | Type | Description |
|---|---|---|---|
| Input | Input Field | Field | A field of triangles. |
| Output | Output Field | Field | A field containing the altered triangles. |
| Output | SampleData | Renderable | A renderable object displaying the input triangles with assigned cell data. |
Properties
| Property | Type | Description |
|---|---|---|
| Execute | Button | The Execute button will force the module to run with the current settings. |
| Remove Coincident Nodes | Boolean | The Remove Coincident Nodes toggle is used to merge nodes that have multiple nodes occupying the same coordinate space. |
| Remove Small Area Cells | Boolean | The Remove Small Area Cells toggle is used to remove extremely small cells (based on area in your coordinate units squared) that sometimes are generated with CAD triangulation routines that might have their normal vectors reversed and would contribute to poor cutting surface definition. |
| Small Area Value | Double | If Remove Small Area Cells is selected the Small Area Value is the cut off value. |
| Split Cells | Boolean | The Split Cells toggle is used to ensure that none of the triangles have an edge longer than the maximum edge length. |
| Maximum Edge Length | Double | The Maximum Edge Length value allows the maximum length of each triangle side to be set for when the Split Cells toggle is set. |
Triangle Normal Settings
| Property | Type | Description |
|---|---|---|
| Fix Normals | Boolean | The Fix Normals toggle is used to check to make sure all of the triangles in selected patches of the surface have the same normal. If the normal is backwards, you can flip the normal of the patch by Ctrl + Left clicking on a cell in the patch that you wish to flip and then adding the patch to the flip list using its cell data value. |
| Picked Cell Number | Integer | The current cell number being probed. This number is just used as a reference when probing. |
| Picked Cell Data | Integer | The current cell data value being probed. This number should be added to the Flip List if that patch needs to be flipped. |
| Flip List | Integer | The list of patches to have their normals flipped. Each patch is identified by its cell data value. |
tubes
The tubes module is used to produce open or closed tubes of constant or data dependent radius using 3D lines or polylines as input. Tube size, number of sides and data dependent coloring is possible.
Rotation of the tubes is done with the Phase slider (or type-in), which is specified in degrees. There are two methods used to maintain continuity of the tube orientation as the path meanders along a 3D path. These are specified as the Phase Determination method:
- Force Z Up: is the default and is most appropriate for paths that stay relatively horizontal. This option keeps the tube faces aligned with the Z axis and therefore with a slope of 30 degrees, the effective cross sectional area of the tube would be reduced by cos(30) which would be a 14% reduction. However for the typical slopes found with tunneling this effect is quite minimal and this option keeps the tube perfectly aligned.
- Perpendicular Extrusions: keeps the tube cross-section aligned with the tube (extrusion) path and therefore preserves the cross-section no matter what the path. However, tube rotation creep is possible.
Ports
| Direction | Name | Type | Description |
|---|---|---|---|
| Input | Input Field | Field | A field of lines to be used in the creation of tubes. |
| Output | Output Field | Field | The tubes field. |
| Output | Output Object | Renderable | A renderable object to display. |
Properties
| Property | Type | Description |
|---|---|---|
| Allow Run | Boolean | Controls whether the module is allowed to execute. |
| Radius By | Choice: Constant, Cell Data Component, Node Data Component | The Radius By choice allows the user to choose constant or data dependent radius scaling. |
| Constant Data For Radius | Double | If Radius By is set to Constant, the Constant Data For Radius can be set using this control. |
| Cell Data For Radius | Choice | The Cell Data for Radius allows you to choose the cell data component for scaling. |
| Nodal Data For Radius | Choice | The Nodal Data for Radius allows you to choose the nodal data component for scaling. |
| Scale Factor | Double | The Scale Factor value is multiplied by the nodal data to determine the radius. |
| Minimum Radius | Double | The Minimum Radius control sets the minimum tube radius. |
| Tolerance | Double | The Tolerance parameter determines the maximum distance between nodes of adjacent line segments before those lines’ nodes should be merged to form a polyline. This also applies to closed polyline contours. Closed polylines will have their starting and ending nodes merged to form closed (toroidal) annuli. |
| Tube Sides | Integer | The Tube Sides value is the number of faces on the tubes. |
| Close Tubes | Boolean | The Close Tubes toggle causes the tubes to have solid ends. However the tubes are not solid objects (they are hollow). |
| Connect Tubes | Boolean | If the Connect Tubes toggle is on, tubes formed by connecting line segments will connect together. |
| Percentile | Double | The Percentile value allows you to control the automatic scaling of tubes based on the nth percentile value (versus the maximum 100th%). This addresses datasets where there are only a few nodes with extremely high values. |
| Phase | Double | The Phase value allows you to control the apparent rotation of tubes. This is specified in degrees of rotation. |
| Phase Determination | Choice: Perpendicular Extrusion, Force Z Up | The Phase Determination is used to set how the tubes are aligned. Perpendicular Extrusion is typically preferred if tubes approach vertical. Force Z Up works better for horizontal tubes. |
Data Output
| Property | Type | Description |
|---|---|---|
| Map Nodal Data | Multi-select | The Map Nodal Data options allow the user to select those nodal data components that are used for coloring or subsequent subsetting operations. |
| Map Cell Data | Multi-select | The Map Cell Data options allow the user to select those cell data components that are used for coloring or subsequent subsetting operations. |
| Include Probing Data | Boolean | The Include Probing Data toggle will tell the module to include the center point of each tube end point as a cell data component. This allows the user to probe onto the tube and return its center instead of the position on the outside of the tube. |
volumetric tunnel
The volumetric tunnel module allows you to create a volumetric tunnel model that is defined by a polygonal surface cross-section along a complex 3D path. Once this volumetric grid is defined, it can be used as input to various modules to map analyte and/or geologic data onto the tunnel. These include:
- 3d estimation: external grid port: to map analytical data
- lithologic modeling: external grid port: to map lithologic data
- interp data: to map analytical data
- interp cell data: to map stratigraphic or lithologic material data
The requirements for the tunnel path and cross-section are:
- The path must be defined by a line input to the Right input port.
- The tunnel cross-section is defined by a surface input to the Left input port.
- The cross-section should be defined in the X-Y plane at Z = 0 (2D)
- The coordinates (size) of the cross-section should be actual scale in the same units as the tunnel path (generally feet or meters).
- Do not use cm for cross-section and meters for path.
- Generally, the X-Y Origin (0, 0) should lie within the cross-section and should represent where the tunnel path should be.
Ports
| Direction | Name | Type | Description |
|---|---|---|---|
| Input | Input Line | Field | A field of lines to be used in the creation of the tunnels. |
| Input | Input Surface | Field | A surface used to extrude along the input line. |
| Output | Output Field | Field | The created tunnel field. |
| Output | Output Object | Renderable | A renderable object to display. |
Properties
| Property | Type | Description |
|---|---|---|
| Allow Run | Boolean | This toggle can prevent the module from running. Allowing the user to make changes to large data sets without waiting for updates. |
| Execute | Button | This button will force the module to run even if the Allow Run toggle has been turned off. This allows the user to make a number of changes before updating. |
| Merge Continuous Paths | Boolean | The Merge Continuous Path toggle controls whether continuous lines and polylines will be handled as single, connected lines to obtain a smooth extrusion without intermediary end caps. |
| Max Step Distance | Double | The Max Step Distance is the maximal distance to subdivide the path by. Generally, cells will never be longer than this distance, but may be shorter at the end of a segment. |
| Offset | Double | The Offset value controls the initial translation of the two-dimensional cross section to allow off-center extrusion or move off-centered cross sections to the origin. |
| Phase Determination | Choice: Perpendicular Extrusion, Force Z Up | The Phase Determination controls the orientation of the input surface along the path. When using Perpendicular Extrusion the surface is extruded perpendicular to the segments of the path. If only rotations around the Z axis should be allowed regardless of the path direction, use Force Z Up. |
| Scale Factor By | Choice: Constant, Node Data Component | The Scale Factor By choice allows the user to choose constant or data dependent scaling. |
| Constant Data For Scale Factor | Double | If Scale Factor By is set to Constant, the constant scale factor can be set using this control. |
| Nodal Data For Scale Factor | Choice | The Nodal Data for Scale Factor allows you to choose the nodal data component for scaling. |
| Rotate By | Choice: Constant, Node Data Component | The Rotate By choice allows the user to choose constant or data dependent rotation. |
| Constant Data For Rotation | Double | If Rotate By is set to Constant, the Constant Data For Rotation can be set using this control. |
| Nodal Data For Rotation | Choice | The Nodal Data for Rotation allows you to choose the nodal data component for rotation. |
Data Output
| Property | Type | Description |
|---|---|---|
| Map Nodal Data | Multi-select | The Map Nodal Data options allow the user to select those nodal data components that are used for coloring or subsequent subsetting operations. |
| Map Cell Data | Multi-select | The Map Cell Data options allow the user to select those cell data components that are used for coloring or subsequent subsetting operations. |
cross section tubes
The cross section tubes module is used to produce open or closed tubes of user defined cross-section and constant or data dependent radius using 3D lines or polylines as input for the centerline and a single 2D polyline as the cross-section of the tubes.
Rotation of the cross-section is done with the Phase slider (or type-in), which is specified in degrees. There are two methods used to maintain continuity of the tube orientation as the path meanders along a 3D path. These are specified as the Phase Determination method:
- Force Z Up: is the default and is most appropriate for paths that stay relatively horizontal. This option keeps the tube cross-section aligned with the Z axis and therefore with a slope of 30 degrees, the effective cross sectional area of the tube would be reduced by cos(30) which would be a 14% reduction. However for the typical slopes found with tunneling this effect is quite minimal and this option keeps the tube perfectly aligned.
- Perpendicular Extrusions: keeps the tube cross-section aligned with the tube (extrusion) path and therefore preserves the cross-section no matter what the path. However, cross-section rotation creep is possible.
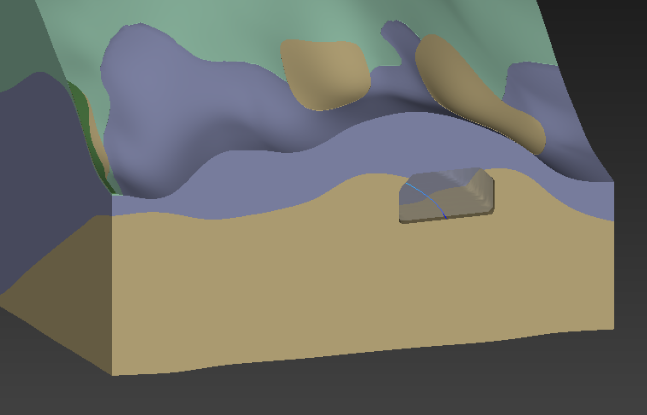
The cross section field input must be a closed polyline that is drawn in the X-Y plane in the correct size. It should be balanced about the origin in X, usually with the Y axis (X=0) at the floor of the tunnel. This results in the tunnel being created such that the tunnel path will be at the centerline FLOOR of the tunnel as shown in the picture below.
Ports
| Direction | Name | Type | Description |
|---|---|---|---|
| Input | Input Field | Field | A field of lines to be used in the creation of tubes. |
| Input | Input Cross Section Field | Field | A field of lines to be used as the cross section of the tubes. |
| Output | Output Field | Field | The tubes field. |
| Output | Output Object | Renderable | A renderable object to display. |
Properties
| Property | Type | Description |
|---|---|---|
| Allow Run | Boolean | Controls whether the module is allowed to execute. |
| Radius By | Choice: Constant, Cell Data Component, Node Data Component | The Radius By choice allows the user to choose constant or data dependent radius scaling. |
| Constant Data For Radius | Double | If Radius By is set to Constant, the Constant Data For Radius can be set using this control. |
| Cell Data For Radius | Choice | The Cell Data for Radius allows you to choose the cell data component for scaling. |
| Nodal Data For Radius | Choice | The Nodal Data for Radius allows you to choose the nodal data component for scaling. |
| Scale Factor | Double | The Scale Factor value is multiplied by the nodal data to determine the radius. |
| Minimum Radius | Double | The Minimum Radius control sets the minimum tube radius. |
| Tolerance | Double | The Tolerance parameter determines the maximum distance between nodes of adjacent line segments before those lines’ nodes should be merged to form a polyline. This also applies to closed polyline contours. Closed polylines will have their starting and ending nodes merged to form closed (toroidal) annuli. |
| Close Tubes | Boolean | The Close Tubes toggle causes the tubes to have solid ends. However the tubes are not solid objects (they are hollow). |
| Connect Tubes | Boolean | If the Connect Tubes toggle is on, tubes formed by connecting line segments will connect together. |
| Percentile | Double | The Percentile value allows you to control the automatic scaling of tubes based on the nth percentile value (versus the maximum 100th%). This addresses datasets where there are only a few nodes with extremely high values. |
| Phase | Double | The Phase value allows you to control the apparent rotation of tubes. This is specified in degrees of rotation. |
| Phase Determination | Choice: Perpendicular Extrusion, Force Z Up | The Phase Determination is used to set how the tubes are aligned. Perpendicular Extrusion is typically preferred if tubes approach vertical. Force Z Up works better for horizontal tubes. |
Data Output
| Property | Type | Description |
|---|---|---|
| Map Nodal Data | Multi-select | The Map Nodal Data options allow the user to select those nodal data components that are used for coloring or subsequent subsetting operations. |
| Map Cell Data | Multi-select | The Map Cell Data options allow the user to select those cell data components that are used for coloring or subsequent subsetting operations. |
| Include Center Data | Boolean | The Include Center Data toggle will tell the module to include the center point of each tube end point as a cell data component. This allows the user to probe onto the tube and return its center instead of the position on the outside of the tube. |
extrude
The extrude module accepts any mesh and adds one to the dimensionality of the input by extruding the mesh in the Z direction. The interface enables changing the height scale for extruded cells and extruding by a constant, any nodal or cell data component. This module is often used with the import vector gis module to convert polygonal shapefiles into extruded volumetric cells.
When Node Data Component is chosen, the output cells will be extruded by the Scale Factor times the value of whichever nodal data component is selected. With nodal data extrusion you must select “Positive Extrusions Only” or “Negative Extrusions Only”. Since each node of a triangle or quadrilateral can have different values, it is possible for a single cell to have both positive and negative data values at its nodes. If this type of cell is extruded both directions, the cell topology can become tangled.
For this reason, nodal data extrusions must be limited to one direction. To extrude in both directions, merely use two extrude modules in parallel, one set to positive and the other to negative.
Ports
| Direction | Name | Type | Description |
|---|---|---|---|
| Input | Scale Factor | Number | The value used for subsetting. |
| Input | Input Field | Field | A field containing nodes or cells to be extruded. |
| Output | Output Field | Field | The extruded field. |
| Output | Output Object | Renderable | A renderable object displaying the extruded data. |
Properties
| Property | Type | Description |
|---|---|---|
| Allow Run | Boolean | Determines whether the module is allowed to execute. |
| Execute | Button | Accept all values and perform extrusion. |
| Extrude By | Choice: Constant, Cell Data Component, Node Data Component | The Extrude By control allows the user to handle the method of extrusion. |
| Constant Value | Double | If the Extrude By selection is set to Constant the Constant Value will be the height of each cell. |
| Cell Data Component | Choice | If the Extrude By selection is set to Cell Data Component, the data component of interest can be selected using this control. |
| Node Data Component | Choice | If the Extrude By selection is set to Node Data Component, the data component of interest can be selected using this control. |
| Limit Extrusion | Choice: Positive Extrusions, Negative Extrusions, No Limit | If the Extrude By selection is set to Node Data Component or Cell Data Component, this setting allows to limit the data values to extrude by to either strictly positive or negative values. Values limited by this option are considered zero. |
| Subdivisions | Integer | The Subdivisions field determines how many cells vertically to create. |
| Scale Factor | Double | The Scale Factor is multiplied by the selected Extrude By value to determine the extrude height. |
| Z Scale | Double | The Z Scale is required to assure that extrusion is conformal to scaled input data. |
| Heading Dip Value | Double | The Heading and Dip values are used to align the extruded points. |
drive glyphs
The drive glyphs module provides a way to move any object (glyph or object from read dxf, etc.) along multiple paths to create a “driving” animation. Glyphs can be positioned along input lines by percentage, by time data on the path, or by data values on the path.
Ports
| Direction | Name | Type | Description |
|---|---|---|---|
| Input | Input Path | Field | The input field containing the lines to drive the glyphs along. |
| Input | Input Glyph | Field | The input field containing the glyph to drive along the input paths. |
| Input | Input Date | Date | Date used for determining glyph position along line. |
| Input | Input Position | Number | The value used for positioning the glyph by percentage. |
| Input | Input Data | Number | The value used for positioning the glyph by data on path. |
| Output | Output Date | Date | Date used for determining glyph position along line. |
| Output | Output Field | Field | The main output field with glyph in the selected position. |
| Output | Output Points | Field | The points used to generate the glyphs in the selected positions. |
| Output | Output Object | Renderable | A renderable object displaying the positioned glyphs. |
| Output | Output Position | Number | The value used for positioning the glyph by percentage. |
| Output | Output Data | Number | The value used for positioning the glyph by data on path. |
Properties
| Property | Type | Description |
|---|---|---|
| Allow Run | Boolean | Determines whether the module is allowed to execute. |
| Execute | Button | Accept all values and places glyphs. |
| Map Component | Choice | The Map Component allows the user to select which data to map from the input path to the output glyph. |
| Data Processing | Choice: Nodal Data, Log10(Nodal Data) | The Data Processing control allows the user to specify how to process the Map Component for output and size. |
| Datamap | Double | The Datamap refers to the min and max values that are used by the datamap. Changing these values can affect both the color range and the glyph size. |
| Glyph Position | Choice: % Along each line, % Along longest line, Sequential Walk, By Time data on path, By Data on path | The Glyph Position allows the user to determine where the glyphs are placed along the input paths. |
| Number Of Glyphs | Integer | Number of glyphs indicates how many glyphs at most will be present along the line. |
| Circulate | Boolean | The Circulate toggle is used for looping or cycling animations. If a glyph’s position is greater than the line length the glyph will be placed the appropriate distance from the start of the line. |
| Glyph Size | Double | The Glyph Size value is used to scale the glyphs in all directions. The default is automatically computed based on your input data. |
| Priority | Choice: Maximum, Minimum | The Priority of the glyph will reverse the scaling so that the smallest sample values have the largest size. |
| Minimum Scale Factor | Double | The Minimum Scale Factor scales the sample values with the least Priority. |
| Maximum Scale Factor | Double | The Maximum Scale Factor scales the sample values with the greatest Priority. |
| Use Log Data | Boolean | The Use Log Data toggle will force the size of the glyph to be based on the log10 of the selected data. |
| Size For Vector Data | Choice: Use Vector Magnitude, Use Vector Components | The Size for Vector Data allows the user to change the method behavior when sizing by a vector data component. |
| Magnitude For Zero Length | Double | Magnitude for Zero Length is the vector magnitude at which the glyphs will be zero size. This establishes the minimum level for taking log values since the log of zero is undefined (minus infinity). |
| Include Center Data | Boolean | The Include Center Data toggle will tell the module to include the center point of each glyph as a cell data component. This allows the user to probe onto the glyph and return its center instead of the position on the outside of the glyph. |
Glyph Settings
| Property | Type | Description |
|---|---|---|
| Glyph Type | Choice: Generated, Input Glyph, Directed Line | The Glyph Type choice allows the user to select the source for the created glyph. Both the Generated and Directed Line options are created internally. The Input Glyph option requires the Input Glyph port to be connected. |
| Include Input Glyph Data | Boolean | If the Glyph Type is set to Input Glyph this toggle will allow data that is associated with the input glyph to be passed through to the output. |
| Generated Glyph | Choice: Sphere, Cube, Cone, Cylinder, Polygon, Disk | The Generated Glyph choice allows the user to select the type of glyph that is automatically generated. |
| Sphere Subdivisions | Integer | The number of subdivisions to use for spheres. Larger numbers create more detailed sphere representations. |
| Glyph Resolution | Integer | The resolution for generated cone, polygon, cylinder, and disk glyphs. |
| Primary Axis Factor | Double | The scale factor for the primary axis of the glyph. |
| Secondary Axis Factor | Double | The scale factor for the secondary axis of the glyph. |
| Heading Dip | Double | The Heading and Dip values are used to align the glyphs to a constant orientation. |
| Roll | Double | The roll of the glyph along its primary axis. |
Percentage Options
| Property | Type | Description |
|---|---|---|
| Position | Double | The Position slider gives the percentage along a line to use for glyph positioning. |
| Position Animation | String | The Position Animation controls the movement (or driving) of the glyphs along the line. |
| Step Size | Double | The Step Size value specifies a value for the increment for advancement when stepping or running. |
Date Options
| Property | Type | Description |
|---|---|---|
| Date Component | Choice | The Date Component allows the user to select which data to use when positioning the glyph by time data. |
| Date | Date | The Date used to position the glyphs. |
| Date Loop | String | The Date Loop controls setting the Date by specified increments. |
| Step Time Units | Choice: Seconds, Minutes, Hours, Days, Weeks, Years | The Step Time Units specify the increment for advancement when stepping or running. |
| Step Size | Double | The Step Size value specifies a factor, along with the Step Time Units, for the increment for advancement when stepping or running. |
| Glyph Placement Method | Choice: By Number Of Glyphs, By Offset Time | The Glyph Placement Method allows the user to select where to set additional glyphs along each line. By Number of Glyphs breaks up the time range by the number of glyphs. By Offset Time allows the user to set the difference in time for all glyphs. |
| Offset Time | Double | When the By Offset Time option is selected in the Glyph Placement Method this control allows the user to set the difference in time used to set the position of the remaining glyphs. |
Data Options
| Property | Type | Description |
|---|---|---|
| Data Component | Choice | The Data Component allows the user to select which data from the input path should be used to position the glyphs. |
| Data Value | Double | The Data Value of interest. |
| Data Loop | String | The Data Loop controls setting the Data by specified increments. |
| Step Size | Double | The Step Size value specifies the increment for advancement when stepping or running. |
| Glyph Placement Method | Choice: By Number Of Glyphs, By Offset Value | The Glyph Placement Method allows the user to select where to set additional glyphs along each line. By Number of Glyphs breaks up the data range by the number of glyphs. By Offset Value allows the user to set the difference in value for all glyphs. |
| Offset Value | Double | When the By Offset Value option is selected in the Glyph Placement Method this control allows the user to set the difference in value used to set the position of the remaining glyphs. |
place glyph
The place glyph module is used to place a single scalable geometric object (glyph) at an interactively determined location. The glyph can be generated internally (sphere, cube, cone, etc.), imported via the Input Glyph port, or represented as a directed line. The position, scale, and orientation of the glyph are fully controllable through the module properties.
Ports
| Direction | Name | Type | Description |
|---|---|---|---|
| Input | Input Field | Field | The input field used to set the coordinate range of the place glyph. |
| Input | Input Glyph | Field | The input field containing the glyph to place. |
| Output | Output Field | Field | The main output field with glyph in the selected position. |
| Output | Output Object | Renderable | A renderable object displaying the positioned glyph. |
Properties
| Property | Type | Description |
|---|---|---|
| Allow Run | Boolean | Determines whether the module is allowed to execute. |
| Execute | Button | Accept all values and places glyphs. |
| Z Scale | Double | Z scale is the scaling factor for vertical (z) coordinates and assures that glyphs remain properly positioned with varying Z Scales. |
| Glyph Scale | Double | The Glyph Scale value is used to scale the glyph in all directions. |
| X Position | Double | Sets the X Position of the output glyph. |
| Y Position | Double | Sets the Y Position of the output glyph. |
| Z Position | Double | Sets the Z Position of the output glyph. |
| Include Center Data | Boolean | The Include Center Data toggle will tell the module to include the center point of each glyph as a cell data component. This allows the user to probe onto the glyph and return its center instead of the position on the outside of the glyph. |
Glyph Settings
| Property | Type | Description |
|---|---|---|
| Glyph Type | Choice: Generated, Input Glyph, Directed Line | The Glyph Type choice allows the user to select the source for the created glyph. Both the Generated and Directed Line options are created internally. The Input Glyph option requires the Input Glyph port to be connected. |
| Include Glyph Data | Boolean | The Include Glyph Data will notify the module to keep data from the Input Glyph field as data for the output. |
| Generated Glyph | Choice: Sphere, Cube, Cone, Cylinder, Polygon, Disk | The Generated Glyph choice allows the user to select the type of glyph that is automatically generated. |
| Sphere Subdivisions | Integer | The number of subdivisions to use for spheres. Larger numbers create more detailed sphere representations. |
| Glyph Resolution | Integer | The resolution for generated cone, polygon, cylinder, and disk glyphs. |
| Primary Axis Factor | Double | The scale factor for the primary axis of the glyph. |
| Secondary Axis Factor | Double | The scale factor for the secondary axis of the glyph. |
| Heading Dip | Double | The Heading and Dip values are used to align the glyphs to a constant orientation. |
| Roll | Double | The roll of the glyph along its primary axis. |
glyphs at nodes
The glyphs at nodes module is used to place geometric objects (glyphs) at nodal locations. The glyphs can be scaled, rotated and colored based on the input data. If the input data is a vector, the glyph can be scaled and rotated to represent the direction and absolute magnitude of the vector field. In a scalar data field, the objects can be scaled based on the magnitude of the scalar. The glyphs can represent the data field of one data component while being colored by another data component. Arrow glyphs are commonly used in vector fields to produce visualizations of the vector field.
Ports
| Direction | Name | Type | Description |
|---|---|---|---|
| Input | Input Field | Field | The field to use for placing glyphs. |
| Input | Input Glyph | Field | The field to use as a glyph. |
| Output | Output Field | Field | The subset field. |
| Output | Output Object | Renderable | A renderable object to display. |
Properties
| Property | Type | Description |
|---|---|---|
| Z Scale | Double | The Z Scale is the vertical exaggeration to be applied to the output object. |
| Allow Run | Boolean | Determines whether the module is allowed to execute. |
| Execute | Button | Accept all values and places glyphs. |
| Orient By | Choice: Nodal Data, Constant | The Orient By option determines how the glyphs are oriented. The Nodal Data option uses the specified nodal data vector component to define the orientation. The Constant option uses the specified heading, dip and roll for all glyphs. |
| Nodal Orientation Component | Choice | The Nodal Orientation Component determines which nodal data component is used to rotate and align the glyphs. This data component should be a vector. |
| Datamap Range | Double | The Datamap range refers to the min and max values that are used by the datamap. This does not change data values from the file. |
| Size By | Choice: Nodal Data, Constant | The Size By option determines how the glyph sizes are determined. The Nodal Data option uses the specified nodal data component to define the sizes. The Constant option uses a constant size defined in the Glyph Size setting for all glyphs. |
| Glyph Size | Double | The Glyph Size value is used to scale the glyphs in all directions. The default is automatically computed based on your input data. |
| Nodal Size Component | Choice | The Nodal Size Component control determines which nodal data component is used to size the glyphs. |
| Use Log Data | Boolean | The Use Log Data toggle will force the size of the glyph to be based on the log10 of the selected data. |
| Priority | Choice: Maximum, Minimum | The Priority of the glyph will reverse the scaling so that the smallest sample values have the largest size. |
| Minimum Scale Factor | Double | The Minimum Scale Factor scales the sample values with the least Priority. |
| Maximum Scale Factor | Double | The Maximum Scale Factor scales the sample values with the greatest Priority. |
| Reverse Direction | Boolean | The Reverse Direction option flips the direction of the input glyph by 180 degrees around the Z-axis. |
| Size For Vector Data | Choice: Use Vector Magnitude, Use Vector Components | The Size for Vector Data allows the user to change the method behavior when sizing by a vector data component. |
| Magnitude For Zero Length | Double | Magnitude for Zero Length is the vector magnitude at which the glyphs will be zero size. This establishes the minimum level for taking log values since the log of zero is undefined (minus infinity). |
| Include Center Data | Boolean | The Include Center Data toggle will tell the module to include the center point of each glyph as a cell data component. This allows the user to probe onto the glyph and return its center instead of the position on the outside of the glyph. |
Glyph Settings
| Property | Type | Description |
|---|---|---|
| Glyph Type | Choice: Generated, Input Glyph, Directed Line | The Glyph Type choice allows the user to select the source for the created glyph. Both the Generated and Directed Line options are created internally. The Input Glyph option requires the Input Glyph port to be connected. |
| Generated Glyph | Choice: Sphere, Cube, Cone, Cylinder, Polygon, Disk, Point | The Generated Glyph choice allows the user to select the type of glyph that is automatically generated. |
| Sphere Subdivisions | Integer | The number of subdivisions to use for spheres. Larger numbers create more detailed sphere representations. |
| Glyph Resolution | Integer | The resolution for generated cone, polygon, cylinder, and disk glyphs. |
| Include Glyph Data | Boolean | The Include Glyph Data will notify the module to keep data from the Input Glyph field as data for the output. |
| Primary Axis Factor | Double | The scale factor for the primary axis of the glyph. |
| Secondary Axis Factor | Double | The scale factor for the secondary axis of the glyph. |
| Heading Dip | Double | The Heading and Dip values are used to align the glyphs to a constant orientation. |
| Roll | Double | The roll of the glyph along its primary axis. |
glyphs at cells
The glyphs at cells module is used to place geometric objects (glyphs) at cell center locations. The glyphs can be scaled, rotated and colored based on the input cell data. If the input data is a vector, the glyph can be scaled and rotated to represent the direction and absolute magnitude of the vector field. In a scalar data field, the objects can be scaled based on the magnitude of the scalar. Arrow glyphs are commonly used in vector fields to produce visualizations of the vector field.
Ports
| Direction | Name | Type | Description |
|---|---|---|---|
| Input | Input Field | Field | The field to use for placing glyphs. |
| Input | Input Glyph | Field | The field to use as a glyph. |
| Output | Output Field | Field | The subset field. |
| Output | Output Object | Renderable | A renderable object to display. |
Properties
| Property | Type | Description |
|---|---|---|
| Z Scale | Double | The Z Scale is the vertical exaggeration to be applied to the output object. |
| Allow Run | Boolean | Determines whether the module is allowed to execute. |
| Execute | Button | Accept all values and places glyphs. |
| Orient By | Choice: Cell Data, Constant | The Orient By option determines how the glyphs are oriented. The Cell Data option uses the specified cell data vector component to define the orientation. The Constant option uses the specified heading, dip and roll for all glyphs. |
| Cell Orientation Component | Choice | The Cell Orientation Component determines which cell data component is used to rotate and align the glyphs. This data component should be a vector. |
| Datamap Range | Double | The Datamap range refers to the min and max values that are used by the datamap. This does not change data values from the file. |
| Size By | Choice: Cell Data, Constant | The Size By option determines how the glyph sizes are determined. The Cell Data option uses the specified cell data component to define the sizes. The Constant option uses a constant size defined in the Glyph Size setting for all glyphs. |
| Glyph Size | Double | The Glyph Size value is used to scale the glyphs in all directions. The default is automatically computed based on your input data. |
| Cell Size Component | Choice | The Cell Size Component control determines which cell data component is used to size the glyphs. |
| Use Log Data | Boolean | The Use Log Data toggle will force the size of the glyph to be based on the log10 of the selected data. |
| Priority | Choice: Maximum, Minimum | The Priority of the glyph will reverse the scaling so that the smallest sample values have the largest size. |
| Minimum Scale Factor | Double | The Minimum Scale Factor scales the sample values with the least Priority. |
| Maximum Scale Factor | Double | The Maximum Scale Factor scales the sample values with the greatest Priority. |
| Reverse Direction | Boolean | The Reverse Direction option flips the direction of the input glyph by 180 degrees around the Z-axis. |
| Size For Vector Data | Choice: Use Vector Magnitude, Use Vector Components | The Size for Vector Data allows the user to change the method behavior when sizing by a vector data component. |
| Magnitude For Zero Length | Double | Magnitude for Zero Length is the vector magnitude at which the glyphs will be zero size. This establishes the minimum level for taking log values since the log of zero is undefined (minus infinity). |
| Include Center Data | Boolean | The Include Center Data toggle will tell the module to include the center point of each glyph as a cell data component. This allows the user to probe onto the glyph and return its center instead of the position on the outside of the glyph. |
Glyph Settings
| Property | Type | Description |
|---|---|---|
| Glyph Type | Choice: Generated, Input Glyph, Directed Line | The Glyph Type choice allows the user to select the source for the created glyph. Both the Generated and Directed Line options are created internally. The Input Glyph option requires the Input Glyph port to be connected. |
| Generated Glyph | Choice: Sphere, Cube, Cone, Cylinder, Polygon, Disk, Point | The Generated Glyph choice allows the user to select the type of glyph that is automatically generated. |
| Sphere Subdivisions | Integer | The number of subdivisions to use for spheres. Larger numbers create more detailed sphere representations. |
| Glyph Resolution | Integer | The resolution for generated cone, polygon, cylinder, and disk glyphs. |
| Include Glyph Data | Boolean | The Include Glyph Data will notify the module to keep data from the Input Glyph field as data for the output. |
| Primary Axis Factor | Double | The scale factor for the primary axis of the glyph. |
| Secondary Axis Factor | Double | The scale factor for the secondary axis of the glyph. |
| Heading Dip | Double | The Heading and Dip values are used to align the glyphs to a constant orientation. |
| Roll | Double | The roll of the glyph along its primary axis. |
create fault surface
The create fault surface module creates a 3D grid that is aligned to a specified strike and dip. The surface can be positioned at a center point, sized, and oriented to represent a fault plane for use with other modules such as distance to surface.
Ports
| Direction | Name | Type | Description |
|---|---|---|---|
| Input | Input Field | Field | A field used to generate the center point. |
| Output | Output Field | Field | The field containing the created fault surface. |
| Output | Fault Surface | Renderable | A renderable object displaying the created fault surface. |
Properties
| Property | Type | Description |
|---|---|---|
| Z Scale | Double | The Z Scale is the vertical exaggeration to apply to the coordinate values of the output. |
| Strike | Double | The Strike value is the direction around the Z axis to align the fault surface. With the value of zero aligned North-South and rotation clockwise. |
| Dip | Double | The Dip value allows the fault surface to rotate around the axis defined by the Strike value. |
| Dip Direction | Choice: N/E, S/W | The Dip Direction controls the direction the Dip rotates around the axis defined by the Strike value. |
| Center Point | Double | The Center Point is the location of the center of the fault surface. It is also used as a center of rotation for the fault surface. |
| X Resolution | Integer | The X Resolution is the number of nodes in the X direction of the grid. |
| Y Resolution | Integer | The Y Resolution is the number of nodes in the Y direction of the grid. |
| Width | Double | The Width field scales the grid in the X direction. |
| Length | Double | The Length field scales the grid in the Y direction. |
| Coordinate Units | String | The Coordinate Units by default are based on either the input field or set to ft. |
create grid
The create grid module produces a 2D or 3D uniform grid that can be used for any purpose. A typical use is starting points for 3d streamlines or advector. In 2D (default) mode it creates a rectangle of user adjustable grid resolution and orientation. In 3D mode it creates a box (3D grid). The number of nodes will depend on the X, Y and optional Z resolutions as well as the cell type specified.
Ports
| Direction | Name | Type | Description |
|---|---|---|---|
| Input | Input Field | Field | An input field used to generate default center and extents. |
| Output | Output Field | Field | The created grid field. |
| Output | Surface | Renderable | A renderable object displaying the created grid. |
Properties
| Property | Type | Description |
|---|---|---|
| Output Cell Type | Choice: Point, Line, Quad, Hex | The Output Cell Type control allows the user to select between creating grids consisting of different cell types. |
| X Resolution | Integer | The X Resolution is the number of nodes in the x direction. |
| Y Resolution | Integer | The Y Resolution is the number of nodes in the y direction. |
| Z Resolution | Integer | The Z Resolution is the number of nodes in the z direction. |
| Grid Rotation | Double | The Grid Rotation allows you to rotate the grid about its center point by a set Azimuth and Inclination. |
| Z Scale | Double | The Z Scale is the vertical exaggeration to be applied to the output object. |
| Center Point | Double | The Center Point is the location of the center of the grid. It is also used as a center of rotation for the grid. |
| I Size | Double | The I Size value controls the size of the grid in the x direction before rotation. |
| J Size | Double | The J Size value controls the size of the grid in the y direction before rotation. |
| K Size | Double | The K Size value controls the size of the grid in the z direction before rotation. |
| Coordinate Units | String | The Coordinate Units by default are based on either the input field or set to ft. |