post samples
The post samples module is used to visualize:
- Sampling locations and the values of the properties in .apdv files
- The lithology specified in a .pgf, .lsdv, .lpdv or .geo files
- The location and values of well screens in a .aidv file
Warning
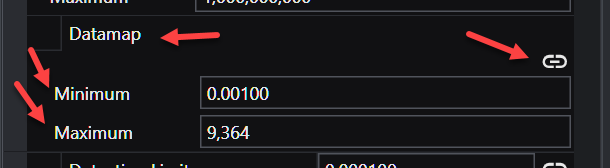
When using the Datamap parameters (Minimum and Maximum) unlinked such that the resulting datamap is a subset of the true data range, probing in C Tech Web Scenes will only be able to report values within the truncated data range. Values outside that limited range will display the nearest value within the truncated range.
Along with a representation of the borings from which the samples/data were collected. The post samples module has the capability to process property values to make the posted data values consistent with data used in kriging modules. Data can be represented as spheres or any user specified glyph. The sampling locations may be colored and sized according to the magnitude of the property value, and labels can be applied to the sampling locations with several different options.
Each sampling location can be probed for data by holding the Ctrl button and left-clicking on the sample location.
When you read any of the supported file types, the module automatically selects the proper default settings to display that data type. However, some file formats can benefit from different options depending on your desires and the quantity of data present.
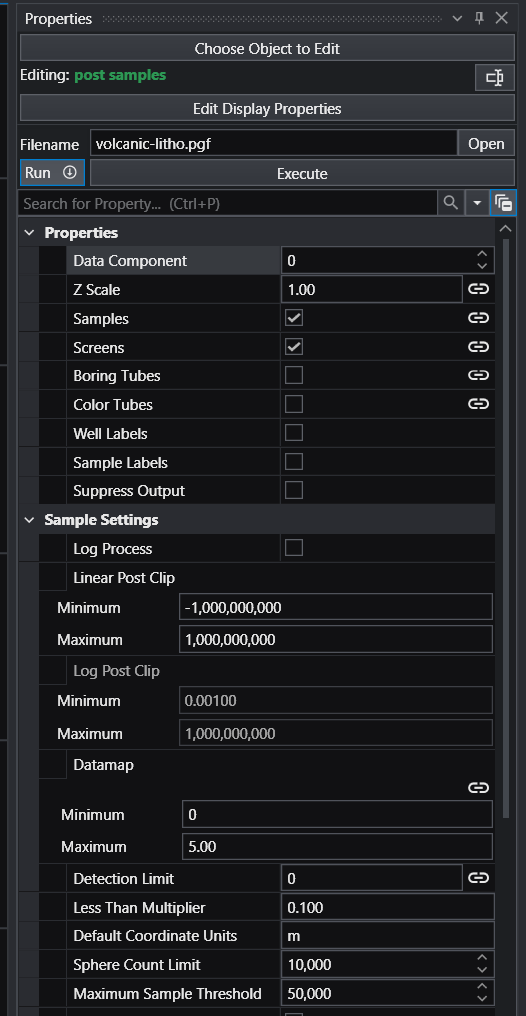
Below is the Properties window for post samples after reading a .PGF file. Note that “Samples” and “Screens” are selected.
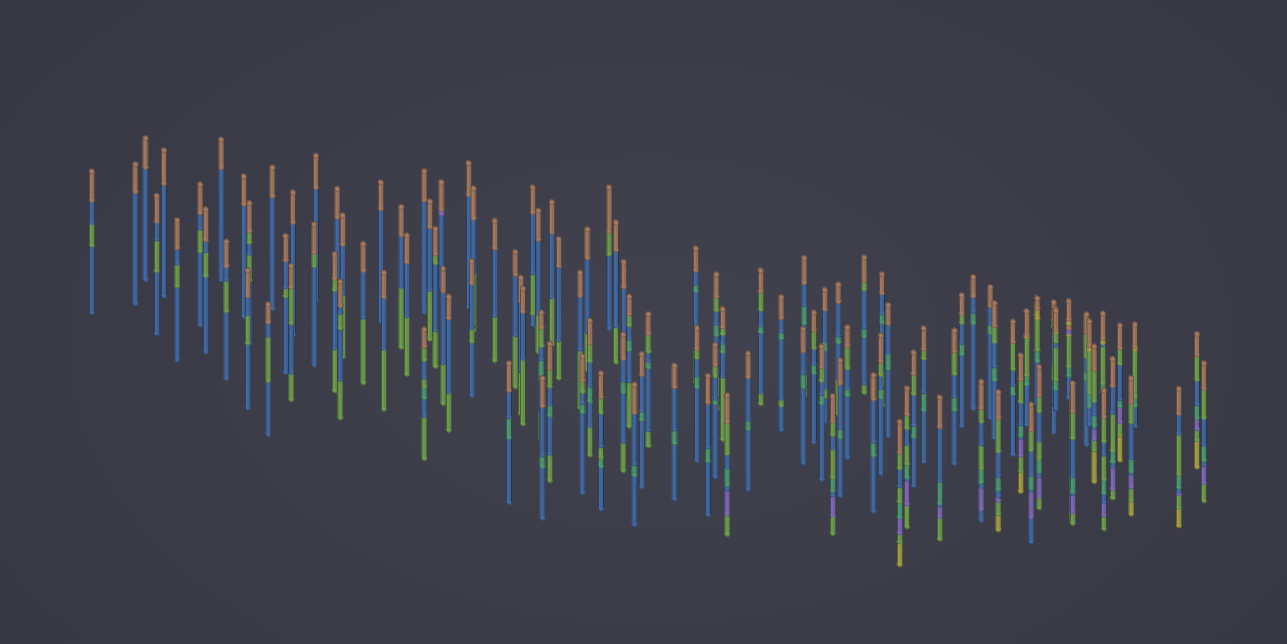
The result in the viewer is below.
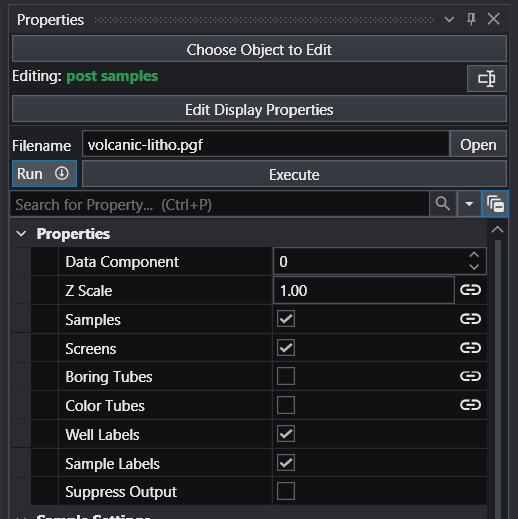
If we turn on Well Labels and Sample Labels (with some subsetting to declutter), the viewer shows:
The post samples module can also represent downhole geophysical logs or Cone Penetration Test (CPT) logs with tubes which are colored and/or sized according to the magnitude of the data. It can display nonvertical borings and data values collected along their length, and can also explode borings and sample locations to show their correct position within exploded geologic layering.
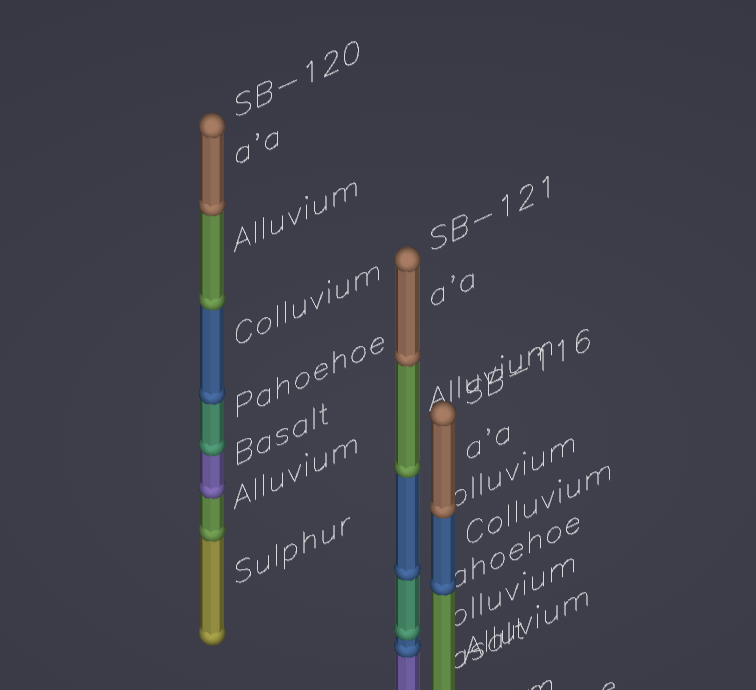
When used to read geology files, post samples will place surface indicators at the top (ground) surface and the bottom of each geologic layer that are colored according to the layer they depict. When a geology file (.geo or .gmf) is exploded without using geologic surface input from gridding and horizons there will be surface indicators at the top and bottom of each layer. You may color the borings by lithology.
Ports
| Direction | Name | Type | Description |
|---|---|---|---|
| Input | Input Filename | String | File used to display data. |
| Input | Input Geologic Field | Field | The geologic field to use for exploding output. |
| Input | Input Date | Date | Date used for interpolating between dates in a time domain file format. |
| Input | Subsetting Feature | Field | A field containing a 2D surface or 1D line for subsetting. |
| Input | Input Z Scale | Number | The factor for vertical scaling. |
| Input | Input Explode | Number | The value used for separating output based on geology. |
| Input | Input Refine Distance | Number | The value used for refining PGF files. |
| Input | Sample Glyph | Field | A field containing a glyph that can be placed at sample locations. |
| Output | Output Filename | String | File used to display data. |
| Output | Output Z Scale | Number | The factor for vertical scaling. |
| Output | Output Refine Distance | Number | The value used for refining PGF files. |
| Output | Output Explode | Number | The value used for separating output based on geology. |
| Output | Analyte Name | String | Text containing the name of the current analyte. |
| Output | Geology Legend | Geology Legend | Geology legend information. |
| Output | Boring Tubes | Field | A field containing the borings tubes. This can be exported as a shapefile or EFB (with EnterVol) for use in ArcGIS. |
| Output | Color Tubes | Field | A field containing the color tube lines. This can be exported as a shapefile or EFB (with EnterVol) for use in ArcGIS. |
| Output | Boring Data | Field | A field containing the data associated with each boring. |
| Output | Output Date | Date | Date used for interpolating between dates in a time domain file format. |
| Output | Sample Data | Renderable | A renderable object displaying the sample data. |
Properties
| Property | Type | Description |
|---|---|---|
| Allow Run | Boolean | This toggle can prevent the module from running. Allowing the user to make changes to large data sets without waiting for updates. |
| Execute | Button | This button will force the module to run even if the Allow Run toggle has been turned off. |
| Filename | String | The file name to process for display. |
| Data Component | Integer | The Data Component is used to select which file data component to process for display. |
| Z Scale | Double | The Z Scale is the vertical exaggeration to apply to the display object. |
| Samples | Boolean | The Samples toggle will prevent or allow samples from being created or displayed. |
| Screens | Boolean | The Screens toggle will prevent or allow screens from being created or displayed. |
| Boring Tubes | Boolean | The Boring Tubes toggle will prevent or allow boring tubes from being created or displayed. |
| Color Tubes | Boolean | The Color Tubes toggle will prevent or allow color tubes from being created or displayed. |
| Well Labels | Boolean | The Well Labels toggle will prevent or allow well labels from being created or displayed. |
| Sample Labels | Boolean | The Sample Labels toggle will prevent or allow sample labels from being created or displayed. |
| Suppress Output | Boolean | Suppress Output is used to prevent updates and warnings from being output. This is useful if running the module in a loop. |
Glyph Settings
| Property | Type | Description |
|---|---|---|
| Glyph Size | Double | The Glyph Size value is used to scale the glyphs in all directions. The default is automatically computed based on your input data. |
| Priority | Choice: Maximum, Minimum | The Priority of the glyph will reverse the scaling so that the smallest sample values have the largest size. |
| Minimum Scale Factor | Double | The Minimum Scale Factor scales the sample values with the least Priority. |
| Maximum Scale Factor | Double | The Maximum Scale Factor scales the sample values with the greatest Priority. |
| Use Log Data | Boolean | The Use Log Data toggle will force the size of the glyph to be based on the log10 of the selected data. |
| Generated Glyph | Choice: Sphere, Cube, Cone, Cylinder, Polygon, Disk | The Generated Glyph choice allows the user to select the type of glyph that is automatically generated. |
| Sphere Subdivisions | Integer | The Sphere Subdivisions defines how finely the sample spheres are rendered. Higher values mean smoother spheres but at a higher memory cost. |
| Glyph Resolution | Integer | The resolution for generated cone, polygon, cylinder, and disk glyphs. |
| Primary Axis Factor | Double | The scale factor for the primary axis of the glyph. |
| Secondary Axis Factor | Double | The scale factor for the secondary axis of the glyph. |
| Heading Dip | Double | The Heading and Dip values are used to align the glyphs to a constant orientation. |
| Roll | Double | The roll of the glyph along its primary axis. |
Sample Settings
| Property | Type | Description |
|---|---|---|
| Data Processing | Choice: Linear Processing, Log Processing | Data Processing will allow the module to be run in either Linear or Log Space. |
| Linear Post Clip | Range (Min/Max) | When Linear Processing is selected, the Linear Post Clip Minimum and Maximum are used after data processing to replace any sample property value that is less than the minimum or greater than the maximum in linear space. |
| Log Post Clip | Range (Min/Max) | When Log Processing is selected, the Log Post Clip Minimum and Maximum are used after data processing to replace any sample property value that is less than the minimum or greater than the maximum in log space. |
| Datamap | Range (Min/Max) | The Datamap refers to the min and max values that are used by the datamap. This does not change data values from the file. |
| Detection Limit | Double | The Detection Limit value affects any file values set with the ‘ND’ or other non-detect flags. When the module encounters this flag in the file it will insert a value equal to (Detection Limit * LT Multiplier). |
| Less Than Multiplier | Double | The Less Than Multiplier is the value applied to any sample with the ‘<’ less than flag. |
| Default Coordinate Units | String | The default coordinate units for the input data. |
| Sphere Count Limit | Integer | The Sphere Count Limit value determines the maximum number of spheres to create. If the number of samples exceeds this value, the module will turn spheres off and generate colored tubes instead. |
| Maximum Sample Threshold | Integer | The Maximum Sample Threshold will set the maximum number of samples from the input file to allow. If the file contains more than this amount an error will occur. |
| Synthetic Only | Boolean | The Synthetic Only toggle is used when reading created drill guide files. This toggle will cause only synthetic drill guide samples to be displayed. |
Subsetting Settings
| Property | Type | Description |
|---|---|---|
| Drop Samples Below | Double | The Drop Samples Below value will allow the user to remove any sample below the set value. |
| Drop Samples Above | Double | The Drop Samples Above value will allow the user to remove any sample above the set value. |
| Spatial Subsetting | Choice: Show All, Rectangular Region, Circular Region, By Expression | Select the type of Spatial Subsetting to perform. |
| Rectangular Region | Double | The Rectangular Region is the domain when subsetting using Rectangular Region. |
| Circular Region Center | Double | The Circular Region Center is used to set the coordinates of the center of the Circular Region for subsetting. |
| Circular Sub Size | Double | The Circular Sub Size is used to set the size of the circle for the Circular Region for subsetting. |
| Control Expression | String | The Control Expression is the expression used by all labels with a linked Expression value. |
| Subset Outside Of Region | Boolean | The Subset Outside Of Region toggle will cause the Spatial Subsetting to subset everything outside of the set region. |
| Distance To Line | Double | The Distance To Line value is used to subset the samples to within a distance from the line passed into the Subsetting Feature port. |
| Straighten To 2D | Boolean | The Straighten to 2D toggle is used to project your 3D borings to a 2D representation. |
| Straightened Plane | Choice: Export in XZ, Export in XY | The Straightened Plane allows the user to set the plane the straightened samples are in. |
Collapse To 2D
| Property | Type | Description |
|---|---|---|
| Collapse 3D To 2D | Choice: Process in 3D, Collapse to 2D | The Collapse 3D To 2D toggle will cause the module to extract a 2D representation of the data. |
| Collapse Method | Choice: Max, Min | The Collapse Method determines how 3D data is reduced to 2D. |
| Distance To Collapse | Double | The Distance To Collapse is the maximum distance in 2D that points will be considered coincident. Coincident points will be dropped depending on the Collapse Method. |
| Sample Z Position | Choice: Maintain sample elevation, Elevation based on data | The Sample Z Position can either be assigned by the Collapse method or the spheres can be positioned by their data value. |
Geology Settings
| Property | Type | Description |
|---|---|---|
| Min Thickness | Double | The Min Thickness is the smallest thickness, in user coordinate units, that a geological layer can have. |
| Explode | Double | The Explode distance can be set here or referenced by connection. For .geo files, the samples will be exploded based upon their layer designations unless a different geology is imported into the module. |
| Reverse Hierarchy | Boolean | The Reverse Hierarchy toggle will reverse the hierarchy of the geology. |
| Screen Refine Distance | Double | The Screen Refine Distance is used to show how lithology screens can be sampled in indicator modules. The refine distance will add samples between the top and bottom until no sample is more than the refine distance apart. |
| Max Points Per Interval | Integer | The Max Points Per Interval is used to cap the number of points created between samples in pgf data. |
| Color Data Component | Choice: Layer, Material, Elevation | The Color Data Component for the sample spheres can be either the geological layer, the material value of that layer, or the elevation of the spheres. |
Time Settings
| Property | Type | Description |
|---|---|---|
| File Is Time Domain | Boolean | The File Is Time Domain toggle turns on date interpolation for time domain analyte (e.g. chemistry) files. |
| Specify Date By Component | Boolean | The Specify Date By Component toggle will cause the Date field to be ignored and the date to be selected using the Data Component. |
| Date | Date | The Date field is the date being interpolated to. The Date can be either set here or passed in via the Date port. |
| Analyte Name | String | The Analyte Name field is used for AIDV and APDV time files as the dates take up the spots in these files usually reserved for analyte names. |
| Default Analyte Units | String | The default analyte units for the input data. |
| Interpolation Method | Choice: Direct Interpolation Only, Interpolate Only, Interpolate and Extrapolate Beyond, Interpolate and Extrapolate | The Interpolation Method defines how to interpolate when given Missing values in a file. See Interpolation Methods below for full details. |
| Use Nearest Measured | Boolean | The Use Nearest Measured Data toggle causes the sample at the interpolated date to have the same value as the nearest measured date and not an interpolated value. |
Interpolation Methods
Each interpolation method defines how to interpolate when given Missing values in a file. Non-Detect values are equal to either the Detection Limit or the Pre Clip Min. If the Date is set to the same time as a Non-Detect in the file, the sample will be a Non-Detect and not an interpolated value.
- Direct Interpolation Only: The most basic interpolation method, and the most accurate in terms of representing the data as it has been entered. Looks at the two dates surrounding the input Date. If either date, or both dates, have Missing as values, the value for that sample will be Missing and no interpolation will occur.
- Interpolate Only: Looks through the date columns both before and after the set Date for values that are not Missing, then interpolates between those numbers. If it fails to find a non-Missing value before and after the set date, it sets the data to Missing. Useful for files with a small amount of Missing values.
- Interpolate and Extrapolate Beyond: Looks through the date columns both before and after the set Date for the first instance of a value that is not Missing. If it does not find a valid non-Missing date after the input Date, it extrapolates beyond the last useable date to the input Date.
- Interpolate and Extrapolate: Looks through the date columns both before and after the set Date for the first instance of a value that is not Missing. If it fails to find one, it extrapolates the first value backwards to the input Date. If the date after the input Date is Missing, it looks forward through the time columns until it finds a date that is not Missing. It also extrapolates beyond the last valid date in the file.
Screen Settings
| Property | Type | Description |
|---|---|---|
| Display Screens As | Choice: Tubes, Wires | Display Interval As controls how the well screens will be displayed. |
| Screen Ratio | Double | The Screen Ratio field is a value between 0.0 and 100.0 that sets what percentage of the Glyph Size the tube size will be. |
| Screen Tube Resolution | Integer | The Tube Resolution value changes the number of divisions used to make each well screen tube. |
| Close Screen Tubes | Boolean | The Close Tubes toggle if turned on will place a disc inside the top and bottom of the tube, giving the well screen tubes a more solid visualization. |
| Connect Screen Lines | Boolean | The Connect Screen Lines toggle is used for non-vertical intervals to merge separate cells into a single seamless tube. |
Boring Tube Settings
| Property | Type | Description |
|---|---|---|
| Display As | Choice: Tubes, Wires | Use Display As to change how the Boring tube is displayed. |
| Tube Ratio | Double | The Tube Ratio field is a value between 0.0 and 100.0 that sets what percentage of the sample sphere minimum size the tube size will be. |
| Tube Resolution | Integer | The Tube Resolution indicates how many faces will be used to create each tube; increasing this number will result in rounder tubes. |
| Tube Top | Double | The Tube Top value will set the top elevation for each tube. If this value has been specified in the file, the file value will be used instead. |
| Main Color | Color | Each boring tube is divided using two colors, the Main Color sets the first of these. |
| Secondary Color | Color | Each boring tube is divided using two colors, the Secondary Color sets the second of these. |
| Color Separation | Double | The Color Separation defines the length both the Main Color and the Secondary Color will go to before switching to the other. |
| Phase | Double | The Phase value allows you to control the apparent rotation of tubes. This is specified in degrees of rotation. |
| Close Tubes | Boolean | The Close Tubes toggle will cause there to be a cap on the top and bottom of each tube, giving each tube a solid look. |
| Connect Lines | Boolean | The Connect Lines toggle is used for non-vertical borings to merge separate cells into a single seamless tube. |
Color Tube Settings
| Property | Type | Description |
|---|---|---|
| Display As | Choice: Tubes, Wires | Use Display As to change how the Color Tube is displayed. |
| Tube Ratio | Double | The Tube Ratio field sets what percentage of the sample sphere minimum size the tube size will be. |
| Tube Resolution | Integer | The Tube Resolution indicates how many faces will be used to create each tube; increasing this number will result in rounder tubes. |
| Max Variation | Double | The Max Variation value is a tool used to correct color blending between samples. |
| Phase | Double | The Phase value allows you to control the apparent rotation of tubes. This is specified in degrees of rotation. |
| Close Color Tubes | Boolean | The Close Tubes toggle will cause there to be a cap on the top and bottom of each tube, giving each tube a solid look. |
| Connect Color Tube Lines | Boolean | The Connect Lines toggle is used for non-vertical borings to merge separate cells into a single seamless tube. |
Label Settings
| Property | Type | Description |
|---|---|---|
| Title | Expression | Title sets the template the title labels are generated with. |
| Title Position | Choice: Top of Boring, Bottom of Boring, Top and Bottom | The Title Position allows the user to place the title label at the top or bottom of the boring. |
| Title Label Settings | Label Settings | Title Label Settings allow well/title labels to be oriented independently from sample and screen labels. |
| Features | Expression | Features sets the template the feature labels are generated with. |
| Default Top | Choice: First Sample, Tube Top | If the ground elevation is not defined in the file, the default can be set to either the first sample in a boring or the Boring Tube Top value. |
| Well Label Radial Offset | Choice: None, Offset | Controls whether the Radial Offset is applied to Well Labels. By default, Well Labels are placed directly above/below the boring; setting this to Offset applies the same Radial Offset used for Sample Labels. |
| Screen Labeling | Choice: At sample, At mid-interval | Screen Labeling allows the user to specify where each feature label will occur. |
| Label Type | Choice: Forward Facing Fonts, TrueType Fonts, Line Fonts | The Label Type allows the user to select between three font types. |
| TrueType Font Style | Font | The TrueType Font Style allows the user to alter the basic look of the font. |
| Sample Label Settings | Label Settings | Sample Label Settings allow the user to align sample and screen labels to an appropriate view. |
| Forward Facing Style | Forward Facing | Forward Facing Style allows the user to align the labels to an appropriate view and to alter the basic layout of the font. |
| Label Color | Color | Label Color allows the color for every label to be set. |
| Top Offset | Double | The Top Offset is for Well Labels only. It is a vertical offset from the top of the boring. |
| Radial Offset | Double | The Radial Offset field is the radial offset for Sample Labels only. This sets the sample label offset from the sample’s center in sphere diameter units. A value of 1.0 is one sample diameter. |
| Label Angle | Double | The Label Angle field determines where in a circle around the sample to place the label. For example a value of zero means place the labels to the direct right of the sample, a value of 90 would place the label directly above the sample. |
| Z Offset | Double | The Z Offset is for Sample Labels only. It is a vertical offset from the sample’s Z coordinate. |
| Label Subsetting | Choice: None, Blank Labels, Boring Min/Max | Label Subsetting allows the user to restrict the number of labels in a rectangular region by using label blanking, or to restrict the number of labels along a boring based on the analytical value. |
| Blank Factor | Double | The Blank Factor value represents a scale used when determining the bounds of a label for overlap avoidance. The scale is based off the height of the label. |
| Favor Min Value | Boolean | The Favor Min Value is used for label subsetting. When overlaps occur, or the Boring Min/Max is selected, this control will keep the lowest value. |