Display your input data.
Separate (or explode) and apply a scaling factor to the vertical dimension (z-coordinate) of cell sets in a model.
Subset a volumetric model and display a non-volumetric shell of a plume.
Subset a volumetric model with multiple subsets and display a non-volumetric shell of the results.
Set min and max values above the true maximum data range and min values below the true minimum data range.
Color surface and volumetric objects in solid colored bands.
Adjust the opacity of any object based on its data values.
Determine the slope and aspect of a surface.
Extract a single node or cell data component from a field.
Read Wavefront OBJ files for display.
Subsections of Display
post samples
The post samples module is used to visualize:
- Sampling locations and the values of the properties in .apdv files
- The lithology specified in a .pgf, .lsdv, .lpdv or .geo files
- The location and values of well screens in a .aidv file
Warning
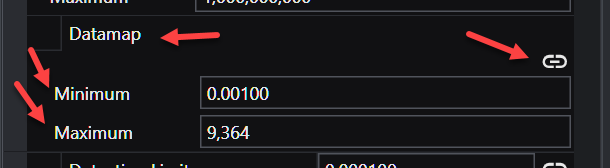
When using the Datamap parameters (Minimum and Maximum) unlinked such that the resulting datamap is a subset of the true data range, probing in C Tech Web Scenes will only be able to report values within the truncated data range. Values outside that limited range will display the nearest value within the truncated range.
Along with a representation of the borings from which the samples/data were collected. The post samples module has the capability to process property values to make the posted data values consistent with data used in kriging modules. Data can be represented as spheres or any user specified glyph. The sampling locations may be colored and sized according to the magnitude of the property value, and labels can be applied to the sampling locations with several different options.
Each sampling location can be probed for data by holding the Ctrl button and left-clicking on the sample location.
When you read any of the supported file types, the module automatically selects the proper default settings to display that data type. However, some file formats can benefit from different options depending on your desires and the quantity of data present.
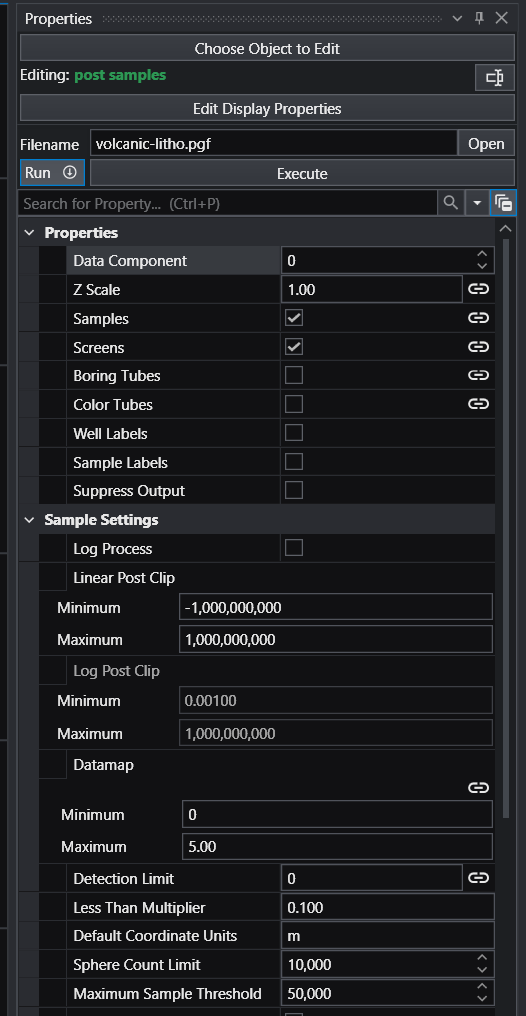
Below is the Properties window for post samples after reading a .PGF file. Note that “Samples” and “Screens” are selected.
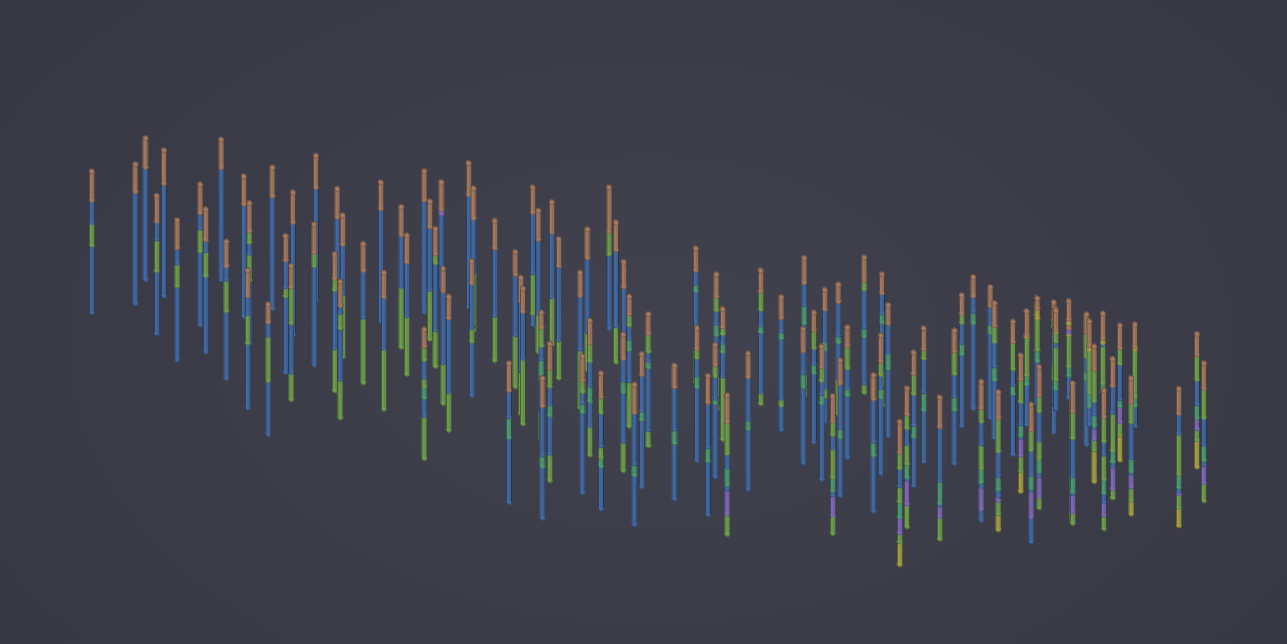
The result in the viewer is below.
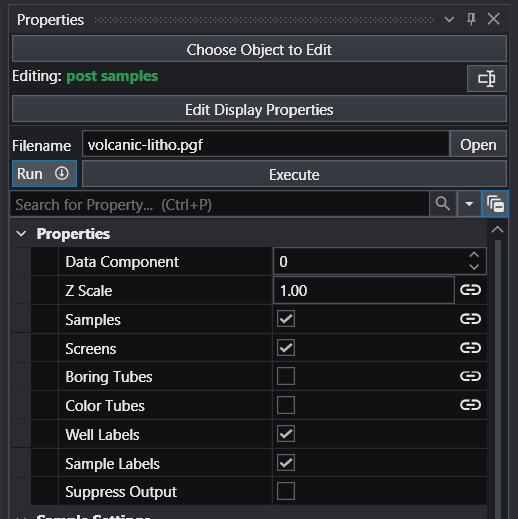
If we turn on Well Labels and Sample Labels (with some subsetting to declutter), the viewer shows:
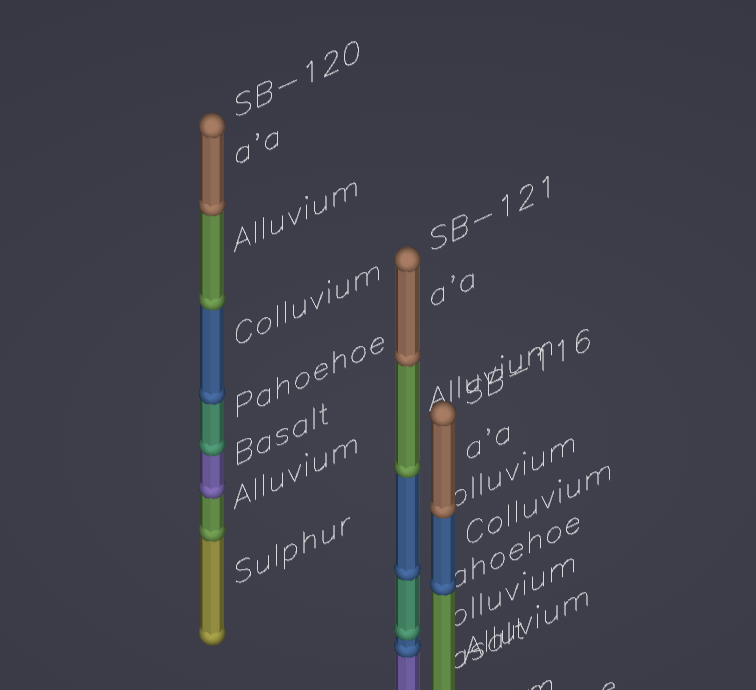
The post samples module can also represent downhole geophysical logs or Cone Penetration Test (CPT) logs with tubes which are colored and/or sized according to the magnitude of the data. It can display nonvertical borings and data values collected along their length, and can also explode borings and sample locations to show their correct position within exploded geologic layering.
When used to read geology files, post samples will place surface indicators at the top (ground) surface and the bottom of each geologic layer that are colored according to the layer they depict. When a geology file (.geo or .gmf) is exploded without using geologic surface input from gridding and horizons there will be surface indicators at the top and bottom of each layer. You may color the borings by lithology.
Ports
| Direction | Name | Type | Description |
|---|---|---|---|
| Input | Input Filename | String | File used to display data. |
| Input | Input Geologic Field | Field | The geologic field to use for exploding output. |
| Input | Input Date | Date | Date used for interpolating between dates in a time domain file format. |
| Input | Subsetting Feature | Field | A field containing a 2D surface or 1D line for subsetting. |
| Input | Input Z Scale | Number | The factor for vertical scaling. |
| Input | Input Explode | Number | The value used for separating output based on geology. |
| Input | Input Refine Distance | Number | The value used for refining PGF files. |
| Input | Sample Glyph | Field | A field containing a glyph that can be placed at sample locations. |
| Output | Output Filename | String | File used to display data. |
| Output | Output Z Scale | Number | The factor for vertical scaling. |
| Output | Output Refine Distance | Number | The value used for refining PGF files. |
| Output | Output Explode | Number | The value used for separating output based on geology. |
| Output | Analyte Name | String | Text containing the name of the current analyte. |
| Output | Geology Legend | Geology Legend | Geology legend information. |
| Output | Boring Tubes | Field | A field containing the borings tubes. This can be exported as a shapefile or EFB (with EnterVol) for use in ArcGIS. |
| Output | Color Tubes | Field | A field containing the color tube lines. This can be exported as a shapefile or EFB (with EnterVol) for use in ArcGIS. |
| Output | Boring Data | Field | A field containing the data associated with each boring. |
| Output | Output Date | Date | Date used for interpolating between dates in a time domain file format. |
| Output | Sample Data | Renderable | A renderable object displaying the sample data. |
Properties
| Property | Type | Description |
|---|---|---|
| Allow Run | Boolean | This toggle can prevent the module from running. Allowing the user to make changes to large data sets without waiting for updates. |
| Execute | Button | This button will force the module to run even if the Allow Run toggle has been turned off. |
| Filename | String | The file name to process for display. |
| Data Component | Integer | The Data Component is used to select which file data component to process for display. |
| Z Scale | Double | The Z Scale is the vertical exaggeration to apply to the display object. |
| Samples | Boolean | The Samples toggle will prevent or allow samples from being created or displayed. |
| Screens | Boolean | The Screens toggle will prevent or allow screens from being created or displayed. |
| Boring Tubes | Boolean | The Boring Tubes toggle will prevent or allow boring tubes from being created or displayed. |
| Color Tubes | Boolean | The Color Tubes toggle will prevent or allow color tubes from being created or displayed. |
| Well Labels | Boolean | The Well Labels toggle will prevent or allow well labels from being created or displayed. |
| Sample Labels | Boolean | The Sample Labels toggle will prevent or allow sample labels from being created or displayed. |
| Suppress Output | Boolean | Suppress Output is used to prevent updates and warnings from being output. This is useful if running the module in a loop. |
Glyph Settings
| Property | Type | Description |
|---|---|---|
| Glyph Size | Double | The Glyph Size value is used to scale the glyphs in all directions. The default is automatically computed based on your input data. |
| Priority | Choice: Maximum, Minimum | The Priority of the glyph will reverse the scaling so that the smallest sample values have the largest size. |
| Minimum Scale Factor | Double | The Minimum Scale Factor scales the sample values with the least Priority. |
| Maximum Scale Factor | Double | The Maximum Scale Factor scales the sample values with the greatest Priority. |
| Use Log Data | Boolean | The Use Log Data toggle will force the size of the glyph to be based on the log10 of the selected data. |
| Generated Glyph | Choice: Sphere, Cube, Cone, Cylinder, Polygon, Disk | The Generated Glyph choice allows the user to select the type of glyph that is automatically generated. |
| Sphere Subdivisions | Integer | The Sphere Subdivisions defines how finely the sample spheres are rendered. Higher values mean smoother spheres but at a higher memory cost. |
| Glyph Resolution | Integer | The resolution for generated cone, polygon, cylinder, and disk glyphs. |
| Primary Axis Factor | Double | The scale factor for the primary axis of the glyph. |
| Secondary Axis Factor | Double | The scale factor for the secondary axis of the glyph. |
| Heading Dip | Double | The Heading and Dip values are used to align the glyphs to a constant orientation. |
| Roll | Double | The roll of the glyph along its primary axis. |
Sample Settings
| Property | Type | Description |
|---|---|---|
| Data Processing | Choice: Linear Processing, Log Processing | Data Processing will allow the module to be run in either Linear or Log Space. |
| Linear Post Clip | Range (Min/Max) | When Linear Processing is selected, the Linear Post Clip Minimum and Maximum are used after data processing to replace any sample property value that is less than the minimum or greater than the maximum in linear space. |
| Log Post Clip | Range (Min/Max) | When Log Processing is selected, the Log Post Clip Minimum and Maximum are used after data processing to replace any sample property value that is less than the minimum or greater than the maximum in log space. |
| Datamap | Range (Min/Max) | The Datamap refers to the min and max values that are used by the datamap. This does not change data values from the file. |
| Detection Limit | Double | The Detection Limit value affects any file values set with the ‘ND’ or other non-detect flags. When the module encounters this flag in the file it will insert a value equal to (Detection Limit * LT Multiplier). |
| Less Than Multiplier | Double | The Less Than Multiplier is the value applied to any sample with the ‘<’ less than flag. |
| Default Coordinate Units | String | The default coordinate units for the input data. |
| Sphere Count Limit | Integer | The Sphere Count Limit value determines the maximum number of spheres to create. If the number of samples exceeds this value, the module will turn spheres off and generate colored tubes instead. |
| Maximum Sample Threshold | Integer | The Maximum Sample Threshold will set the maximum number of samples from the input file to allow. If the file contains more than this amount an error will occur. |
| Synthetic Only | Boolean | The Synthetic Only toggle is used when reading created drill guide files. This toggle will cause only synthetic drill guide samples to be displayed. |
Subsetting Settings
| Property | Type | Description |
|---|---|---|
| Drop Samples Below | Double | The Drop Samples Below value will allow the user to remove any sample below the set value. |
| Drop Samples Above | Double | The Drop Samples Above value will allow the user to remove any sample above the set value. |
| Spatial Subsetting | Choice: Show All, Rectangular Region, Circular Region, By Expression | Select the type of Spatial Subsetting to perform. |
| Rectangular Region | Double | The Rectangular Region is the domain when subsetting using Rectangular Region. |
| Circular Region Center | Double | The Circular Region Center is used to set the coordinates of the center of the Circular Region for subsetting. |
| Circular Sub Size | Double | The Circular Sub Size is used to set the size of the circle for the Circular Region for subsetting. |
| Control Expression | String | The Control Expression is the expression used by all labels with a linked Expression value. |
| Subset Outside Of Region | Boolean | The Subset Outside Of Region toggle will cause the Spatial Subsetting to subset everything outside of the set region. |
| Distance To Line | Double | The Distance To Line value is used to subset the samples to within a distance from the line passed into the Subsetting Feature port. |
| Straighten To 2D | Boolean | The Straighten to 2D toggle is used to project your 3D borings to a 2D representation. |
| Straightened Plane | Choice: Export in XZ, Export in XY | The Straightened Plane allows the user to set the plane the straightened samples are in. |
Collapse To 2D
| Property | Type | Description |
|---|---|---|
| Collapse 3D To 2D | Choice: Process in 3D, Collapse to 2D | The Collapse 3D To 2D toggle will cause the module to extract a 2D representation of the data. |
| Collapse Method | Choice: Max, Min | The Collapse Method determines how 3D data is reduced to 2D. |
| Distance To Collapse | Double | The Distance To Collapse is the maximum distance in 2D that points will be considered coincident. Coincident points will be dropped depending on the Collapse Method. |
| Sample Z Position | Choice: Maintain sample elevation, Elevation based on data | The Sample Z Position can either be assigned by the Collapse method or the spheres can be positioned by their data value. |
Geology Settings
| Property | Type | Description |
|---|---|---|
| Min Thickness | Double | The Min Thickness is the smallest thickness, in user coordinate units, that a geological layer can have. |
| Explode | Double | The Explode distance can be set here or referenced by connection. For .geo files, the samples will be exploded based upon their layer designations unless a different geology is imported into the module. |
| Reverse Hierarchy | Boolean | The Reverse Hierarchy toggle will reverse the hierarchy of the geology. |
| Screen Refine Distance | Double | The Screen Refine Distance is used to show how lithology screens can be sampled in indicator modules. The refine distance will add samples between the top and bottom until no sample is more than the refine distance apart. |
| Max Points Per Interval | Integer | The Max Points Per Interval is used to cap the number of points created between samples in pgf data. |
| Color Data Component | Choice: Layer, Material, Elevation | The Color Data Component for the sample spheres can be either the geological layer, the material value of that layer, or the elevation of the spheres. |
Time Settings
| Property | Type | Description |
|---|---|---|
| File Is Time Domain | Boolean | The File Is Time Domain toggle turns on date interpolation for time domain analyte (e.g. chemistry) files. |
| Specify Date By Component | Boolean | The Specify Date By Component toggle will cause the Date field to be ignored and the date to be selected using the Data Component. |
| Date | Date | The Date field is the date being interpolated to. The Date can be either set here or passed in via the Date port. |
| Analyte Name | String | The Analyte Name field is used for AIDV and APDV time files as the dates take up the spots in these files usually reserved for analyte names. |
| Default Analyte Units | String | The default analyte units for the input data. |
| Interpolation Method | Choice: Direct Interpolation Only, Interpolate Only, Interpolate and Extrapolate Beyond, Interpolate and Extrapolate | The Interpolation Method defines how to interpolate when given Missing values in a file. See Interpolation Methods below for full details. |
| Use Nearest Measured | Boolean | The Use Nearest Measured Data toggle causes the sample at the interpolated date to have the same value as the nearest measured date and not an interpolated value. |
Interpolation Methods
Each interpolation method defines how to interpolate when given Missing values in a file. Non-Detect values are equal to either the Detection Limit or the Pre Clip Min. If the Date is set to the same time as a Non-Detect in the file, the sample will be a Non-Detect and not an interpolated value.
- Direct Interpolation Only: The most basic interpolation method, and the most accurate in terms of representing the data as it has been entered. Looks at the two dates surrounding the input Date. If either date, or both dates, have Missing as values, the value for that sample will be Missing and no interpolation will occur.
- Interpolate Only: Looks through the date columns both before and after the set Date for values that are not Missing, then interpolates between those numbers. If it fails to find a non-Missing value before and after the set date, it sets the data to Missing. Useful for files with a small amount of Missing values.
- Interpolate and Extrapolate Beyond: Looks through the date columns both before and after the set Date for the first instance of a value that is not Missing. If it does not find a valid non-Missing date after the input Date, it extrapolates beyond the last useable date to the input Date.
- Interpolate and Extrapolate: Looks through the date columns both before and after the set Date for the first instance of a value that is not Missing. If it fails to find one, it extrapolates the first value backwards to the input Date. If the date after the input Date is Missing, it looks forward through the time columns until it finds a date that is not Missing. It also extrapolates beyond the last valid date in the file.
Screen Settings
| Property | Type | Description |
|---|---|---|
| Display Screens As | Choice: Tubes, Wires | Display Interval As controls how the well screens will be displayed. |
| Screen Ratio | Double | The Screen Ratio field is a value between 0.0 and 100.0 that sets what percentage of the Glyph Size the tube size will be. |
| Screen Tube Resolution | Integer | The Tube Resolution value changes the number of divisions used to make each well screen tube. |
| Close Screen Tubes | Boolean | The Close Tubes toggle if turned on will place a disc inside the top and bottom of the tube, giving the well screen tubes a more solid visualization. |
| Connect Screen Lines | Boolean | The Connect Screen Lines toggle is used for non-vertical intervals to merge separate cells into a single seamless tube. |
Boring Tube Settings
| Property | Type | Description |
|---|---|---|
| Display As | Choice: Tubes, Wires | Use Display As to change how the Boring tube is displayed. |
| Tube Ratio | Double | The Tube Ratio field is a value between 0.0 and 100.0 that sets what percentage of the sample sphere minimum size the tube size will be. |
| Tube Resolution | Integer | The Tube Resolution indicates how many faces will be used to create each tube; increasing this number will result in rounder tubes. |
| Tube Top | Double | The Tube Top value will set the top elevation for each tube. If this value has been specified in the file, the file value will be used instead. |
| Main Color | Color | Each boring tube is divided using two colors, the Main Color sets the first of these. |
| Secondary Color | Color | Each boring tube is divided using two colors, the Secondary Color sets the second of these. |
| Color Separation | Double | The Color Separation defines the length both the Main Color and the Secondary Color will go to before switching to the other. |
| Phase | Double | The Phase value allows you to control the apparent rotation of tubes. This is specified in degrees of rotation. |
| Close Tubes | Boolean | The Close Tubes toggle will cause there to be a cap on the top and bottom of each tube, giving each tube a solid look. |
| Connect Lines | Boolean | The Connect Lines toggle is used for non-vertical borings to merge separate cells into a single seamless tube. |
Color Tube Settings
| Property | Type | Description |
|---|---|---|
| Display As | Choice: Tubes, Wires | Use Display As to change how the Color Tube is displayed. |
| Tube Ratio | Double | The Tube Ratio field sets what percentage of the sample sphere minimum size the tube size will be. |
| Tube Resolution | Integer | The Tube Resolution indicates how many faces will be used to create each tube; increasing this number will result in rounder tubes. |
| Max Variation | Double | The Max Variation value is a tool used to correct color blending between samples. |
| Phase | Double | The Phase value allows you to control the apparent rotation of tubes. This is specified in degrees of rotation. |
| Close Color Tubes | Boolean | The Close Tubes toggle will cause there to be a cap on the top and bottom of each tube, giving each tube a solid look. |
| Connect Color Tube Lines | Boolean | The Connect Lines toggle is used for non-vertical borings to merge separate cells into a single seamless tube. |
Label Settings
| Property | Type | Description |
|---|---|---|
| Title | Expression | Title sets the template the title labels are generated with. |
| Title Position | Choice: Top of Boring, Bottom of Boring, Top and Bottom | The Title Position allows the user to place the title label at the top or bottom of the boring. |
| Title Label Settings | Label Settings | Title Label Settings allow well/title labels to be oriented independently from sample and screen labels. |
| Features | Expression | Features sets the template the feature labels are generated with. |
| Default Top | Choice: First Sample, Tube Top | If the ground elevation is not defined in the file, the default can be set to either the first sample in a boring or the Boring Tube Top value. |
| Well Label Radial Offset | Choice: None, Offset | Controls whether the Radial Offset is applied to Well Labels. By default, Well Labels are placed directly above/below the boring; setting this to Offset applies the same Radial Offset used for Sample Labels. |
| Screen Labeling | Choice: At sample, At mid-interval | Screen Labeling allows the user to specify where each feature label will occur. |
| Label Type | Choice: Forward Facing Fonts, TrueType Fonts, Line Fonts | The Label Type allows the user to select between three font types. |
| TrueType Font Style | Font | The TrueType Font Style allows the user to alter the basic look of the font. |
| Sample Label Settings | Label Settings | Sample Label Settings allow the user to align sample and screen labels to an appropriate view. |
| Forward Facing Style | Forward Facing | Forward Facing Style allows the user to align the labels to an appropriate view and to alter the basic layout of the font. |
| Label Color | Color | Label Color allows the color for every label to be set. |
| Top Offset | Double | The Top Offset is for Well Labels only. It is a vertical offset from the top of the boring. |
| Radial Offset | Double | The Radial Offset field is the radial offset for Sample Labels only. This sets the sample label offset from the sample’s center in sphere diameter units. A value of 1.0 is one sample diameter. |
| Label Angle | Double | The Label Angle field determines where in a circle around the sample to place the label. For example a value of zero means place the labels to the direct right of the sample, a value of 90 would place the label directly above the sample. |
| Z Offset | Double | The Z Offset is for Sample Labels only. It is a vertical offset from the sample’s Z coordinate. |
| Label Subsetting | Choice: None, Blank Labels, Boring Min/Max | Label Subsetting allows the user to restrict the number of labels in a rectangular region by using label blanking, or to restrict the number of labels along a boring based on the analytical value. |
| Blank Factor | Double | The Blank Factor value represents a scale used when determining the bounds of a label for overlap avoidance. The scale is based off the height of the label. |
| Favor Min Value | Boolean | The Favor Min Value is used for label subsetting. When overlaps occur, or the Boring Min/Max is selected, this control will keep the lowest value. |
explode and scale
The explode and scale module is used to separate (or explode) and apply a scaling factor to the vertical dimension (z-coordinate) of objects in a model. explode and scale can also translate the fields in the z direction, and control the visibility of individual cell sets (e.g. geologic layers).
Ports
| Direction | Name | Type | Description |
|---|---|---|---|
| Input | Input Field | Field | A field containing a mesh for scaling and/or exploding. |
| Input | Input Z Scale | Number | The factor for vertical scaling. |
| Input | Input Explode | Number | The value used for separating output based on geology. |
| Output | Output Z Scale | Number | The factor for vertical scaling. |
| Output | Output Explode | Number | The value used for separating output based on geology. |
| Output | Output Field | Field | A field containing the scaled and exploded field. |
Properties
| Property | Type | Description |
|---|---|---|
| Allow Run | Boolean | The Allow Run toggle when selected will cause the module to run when any value is changed. |
| Execute | Button | Forces the module to run. |
| Z Scale | Double | Z scale is the scaling factor for vertical (z) coordinates. This value reflects a multiplication factor of the layer thickness. For example, a layer that is 10 feet thick that is subjected to a z-exaggeration value of 4 will appear 40 feet thick in the viewer. |
| Explode | Double | The Explode value is the distance between exploded layers, cell sets or materials. For example, an explode distance of 20 will separate each geologic layer by 20 feet from the layer above it and the layer below it. Note that the explode distance incorporates the scale factor. |
| Vertical Offset | Double | Vertical Offset translates your entire model in Z by the value input multiplied by the Z Exaggeration. This is useful if you want to move your model to avoid having coincident objects. |
Explode And Scale Settings
| Property | Type | Description |
|---|---|---|
| Explode By | Choice: Layer, Material, Cell Set, Lithology | The Explode By options determine what information is used to explode the layers or materials. Layer and Material are nodal data components that should be present with any hierarchical geologic model. The Cell Set option allows you to explode by the Cell Set number. The Lithology option is to be used only with Adaptive Indicator Kriged geologic models. |
| Explode Begins | Integer | Explode Begins determines the first layer or material that will be exploded. |
| Explode Ends | Integer | Explode Ends sets the last layer/material which will be exploded. This value defaults to -1 which will explode all remaining layers or materials. |
| Cell Sets | Multi-select | The Cell Sets control allows selected cell sets to be turned off in the output. |
plume shell
The plume shell module creates the external faces of a volumetric subset of a 3D input. The resulting closed volume “shell” generally is used only as a visualization of a plume and would not be used as input for further subsetting or volumetric computations since it is hollow (empty). This module creates a superior visualization of a plume as compared with other modules such as plume passing to external faces and is quicker and more memory efficient.
Info
- The plume shell module may be controlled with the driven sequence module.
Ports
| Direction | Name | Type | Description |
|---|---|---|---|
| Input | Input Field | Field | A field containing nodal data. |
| Input | Input Isolevel | Number | The value used for subsetting. |
| Output | Output Isolevel | Number | The value used for subsetting. |
| Output | Status | String | Text containing the subsetting information. |
| Output | Output Field | Field | A field containing a new unstructured mesh which contains the surfaces which are the external faces of a subset of the input. |
| Output | Plume | Renderable | A renderable object displaying the subsetted plume data. |
| Output | Output Sequence | Sequence | The generated sequence of states. |
Properties
| Property | Type | Description |
|---|---|---|
| Allow Run | Boolean | The Allow Run toggle will prevent the module from running when unselected. |
| Execute | Button | Forces the module to run. |
| Above Direction String | String | When the Subsetting Direction is set to Subset Above Level, the Direction String will use this string as its identifier. |
| Below Direction String | String | When the Subsetting Direction is set to Subset Below Level, the Direction String will use this string as its identifier. |
| Status Expression | String | The Status Expression sets the template which is used to generate the status string, and the title for each state of the sequence. |
| Use Sequencing | Boolean | Turning this on allows the sequences to drive the module instead of the positions. |
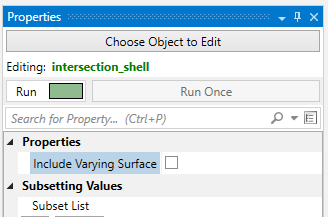
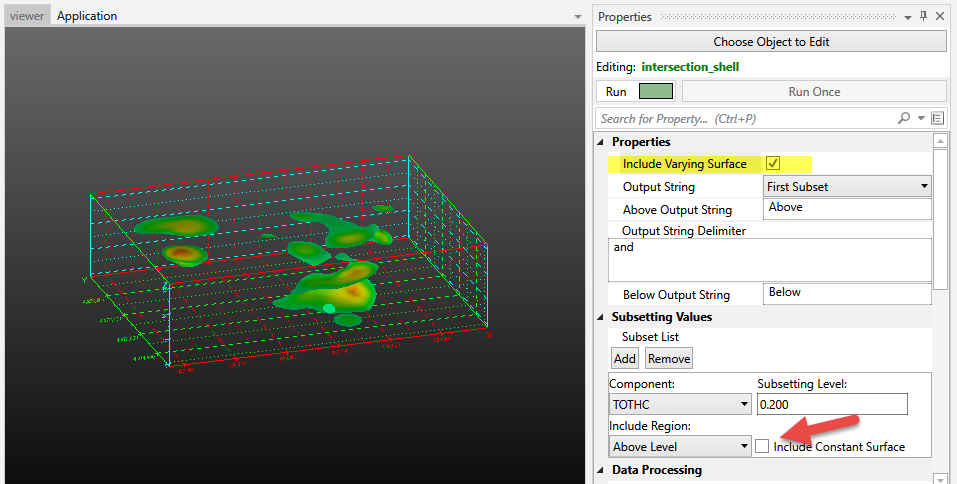
| Include Varying Surface | Boolean | The Include Varying Surface Toggle controls the visibility of the surface having varying data. |
Data Processing
| Property | Type | Description |
|---|---|---|
| Subsetting Component | Choice | The Subsetting Component is the nodal data value to use to subset the input by. |
| Subsetting Level | Double | The Subsetting Level is used to set the level for subsetting the input field. |
| Subsetting Direction | Choice: Subset Below level, Subset Above level | The Subsetting Direction choice allows the user to select which range of values to include in the output. |
| Output Nodal Data | Multi-select | The Output Nodal Data choice allows the user to select the nodal data to include in the output. |
| Output Cell Data | Multi-select | The Output Cell Data choice allows the user to select the cell data to include in the output. |
Sequence Settings
| Property | Type | Description |
|---|---|---|
| Current State | Choice | The current state to be passed to the script. |
| State Control | Choice: Slider, Combo Box, List Box | The State Control determines how the user will interact with the created sequence of states. |
| Allow Cycles | Boolean | Allows the state control to be cycled in CTWS files. |
| Sequence Generation Properties | Value generator | Generates the list of values for sequencing. Methods: Linear By Step (values from an anchor point at a fixed step size), Linear By Count (a fixed number of evenly-spaced values), User Entries (manually specified values), Per Log Decade (logarithmic spacing with a set number of values per decade). |
External Faces
| Property | Type | Description |
|---|---|---|
| Split Edges | Boolean | Split surfaces when the edge between two neighboring cells is sharp. This improves rendering in most cases. |
| Constant Surfaces Are Not Split | Boolean | When on, the constant surfaces in the resulting plume are not split. This gives them a smoother appearance in some cases. |
| Split Edge Angle | Double | The Split Edge Angle is the maximum angle allowed between two adjacent faces before they are disconnected to create visually sharp edges. |
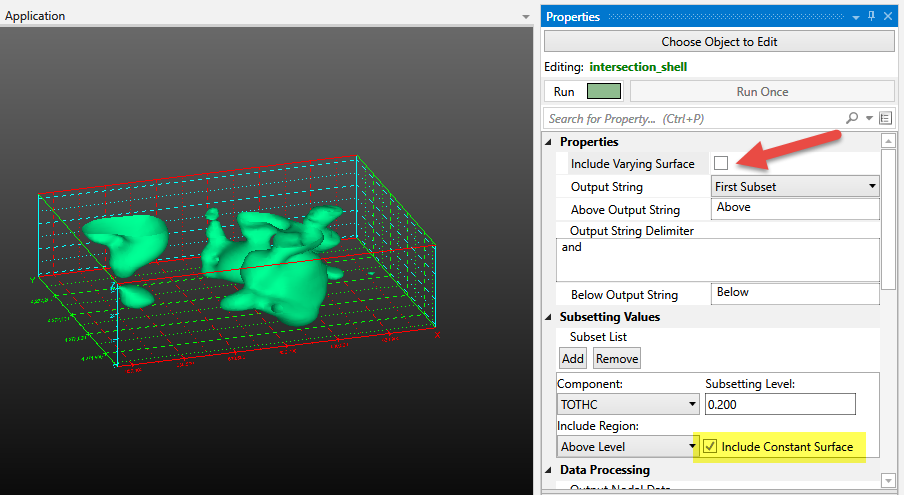
intersection shell
The intersection shell is a powerful module that incorporates some of the characteristics of plume shell, yet allows for a large number of sequential (serial) subsetting operations, just like intersection.
To get the functionality of (the now deprecated) constant shell module, you would turn off Include Varying Surface.
Because this module has “intersection” in its name, it allows you to add any number of subsetting operations.
Each operation can be “Above” or “Below” the specified Threshold value, which in Boolean terms corresponds to:
- A and B where both the A & B operations are set to Above or
- A and (NOT B) where the A operation is set to above and the B operation is set to Below.
However the operator is always “and” for intersection modules. If you need an “or” operator to achieve your subsetting, you need the union module.
This module creates an efficient and superior visualization of a plume that can be sent directly to the viewer for rendering. The intersection shell module outputs a specialized version of a sequentially subset plume that is suitable for VRML export for 3D printing to create full color physical models.
For output to 3D printing, please jump to the Issues for 3D Printing topic.
Without intersection shell it is very difficult if not impossible to create a VRML file suitable for printing, especially with complex models.
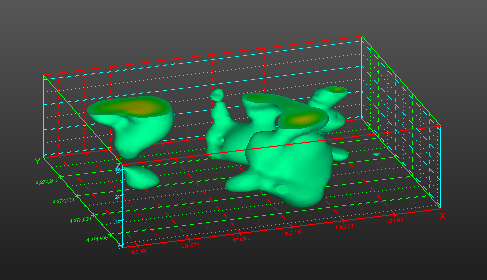
intersection shell is the module that can create an ISOSURFACE. In other words, a surface (not volume) representing part(s) of your plume.
It has two (+) toggles which control the visibility of a plume “shell”.
In general a plume external shell has two components: that portion which is exactly EQUAL to the Subsetting Level, and that portion which is greater than the Subsetting Level.
When both toggles are on (default) the plume is:
If you display only the Constant Surface (component 1) you get this:
If you display only the Varying Surface (component 2) you get this:
Ports
| Direction | Name | Type | Description |
|---|---|---|---|
| Input | Input Field | Field | The field to use for subsetting. |
| Output | Output Field | Field | The subset field. |
| Output | Status | String | Text containing the intersection subset information. |
| Output | Output Object | Renderable | A renderable object to display. |
Properties
| Property | Type | Description |
|---|---|---|
| Allow Run | Boolean | The Allow Run Toggle will prevent the module from running. This allows the user to make multiple changes without the module constantly updating. |
| Execute | Button | The Run Once button will cause the module to run one time even if the Allow Run toggle has been turned off. |
| Include Varying Surface | Boolean | The Include Varying Surface Toggle controls the visibility of the surface(s) having varying data (based on the Map Component). The ability to control visibility of portions of the output allows you to use multiple intersection shell modules and color or texture map portions of each plume differently. |
| Output String | Choice: First Subset, All Subsets, Last Subset | The Output String contains the name(s) and value(s) of the intersection subsets. |
| Above Output String | String | When the Include Region is set to Above, the Output String will use this string as its identifier. |
| Output String Delimiter | String | When the Output String consists of All Subsets, the Delimiter is the string occurring between each subset text. |
| Below Output String | String | When the Include Region is set to Below, the Output String will use this string as its identifier. |
Subsetting Values
| Property | Type | Description |
|---|---|---|
| Subset List | Multi-select | The list of serial subsets. Each subset includes a component, subsetting direction, subsetting level, and constant surface inclusion toggle. |
Data Processing
| Property | Type | Description |
|---|---|---|
| Output Nodal Data | Multi-select | The Output Nodal Data choice allows the user to select the nodal data to include in the output. |
| Output Cell Data | Multi-select | The Output Cell Data choice allows the user to select the cell data to include in the output. |
External Faces
| Property | Type | Description |
|---|---|---|
| Split Edges | Boolean | Split surfaces when the edge between two neighboring cells is sharp. This improves rendering in most cases. |
| Constant Surfaces Are Not Split | Boolean | When on, the constant surfaces in the resulting plume are not split. This gives them a smoother appearance in some cases. |
| Split Edge Angle | Double | The Split Edge Angle is the maximum angle allowed between two adjacent faces before they are disconnected to create visually sharp edges. |
change minmax
The change minmax module allows you to override the minimum and/or maximum data values for coloring purposes. This functionality is commonly needed when working with time-series data. For example, the user can set the minmax values to bracket the widest range achieved for many datasets, thus allowing consistent mapping from dataset to dataset during a time-series animation or individual sub-sites.
This way 100 ppm would always be red throughout the animation, and if some times did not reach a maximum of 100 ppm, there would be no red color mapping for those time-steps.
NOTE: The Clamp toggle actually changes the data. Use with caution as this will change volumetrics results.
Warning
When using unlinked values (Min and Max) such that the resulting datamap is a subset of the true data range, probing in C Tech Web Scenes will only be able to report values within the truncated data range. Values outside that limited range will display the nearest value within the truncated range.
Ports
| Direction | Name | Type | Description |
|---|---|---|---|
| Input | Input Field | Field | The field to use for data. |
| Output | Output Field | Field | The field with altered min max data. |
| Output | Output Object | Renderable | A renderable object to display. |
Properties
Nodal Data Ranges
| Property | Type | Description |
|---|---|---|
| Change Nodal Data | Multi-select | For each nodal data component, allows override of the minimum and maximum values, with options for linked/unlinked ranges, calculation method, and clamping. |
Cell Data Ranges
| Property | Type | Description |
|---|---|---|
| Change Cell Data | Multi-select | For each cell data component, allows override of the minimum and maximum values, with options for linked/unlinked ranges, calculation method, and clamping. |
band data
band data provides a means to color surfaces or volumetric objects (converted to surfaces) in solid colored bands.
band data can contour by both nodal and cell data.
This module does not do subsetting like plume shell or plume. It is used in conjunction with these modules to change the way their output is colored.
Ports
| Direction | Name | Type | Description |
|---|---|---|---|
| Input | Input Field | Field | The field to use for contouring. |
| Input | Input Contour levels | Contours | Information required to properly set contour levels. |
| Output | Output Field | Field | The subset field. |
| Output | Output Contour levels | Contours | Information used to set contour levels. |
| Output | Output Object | Renderable | A renderable object to display. |
Properties
| Property | Type | Description |
|---|---|---|
| Allow Run | Boolean | The Allow Run Toggle will prevent the module from running. This allows the user to make multiple changes without the module constantly updating. |
| Execute | Button | The Run Once button will cause the module to run one time even if the Allow Run toggle has been turned off. |
| Contour By | Choice: Nodal Data, Cell Data | The Contour By control selects the type of data to use in contouring. |
| Prepend Contoured String | Boolean | The Prepend Contoured String toggle when selected will add the “Contoured” string to the output data component. This allows the user to indicate the data has been altered by the module. |
| Contour Component | Choice | The Contour Component refers to the nodal data component that will be used to create the contours. |
| Cell Contour Component | Choice | The Contour Component refers to the cell data component that will be used to create the contours. |
| Band Data | Choice: Min of Band, Average Of Band, Max of Band | Band Data assigns the color of each contour using one of three options based on the minimum, average, or maximum value of each band according to your Datamap. |
| Contour Distribution | Choice: Automatically set contour levels, User defined contour levels | The Contour Distribution allows the user to choose between automatically generating contour levels or setting them by hand. |
| Logarithmic Decades | Choice: Log, Unformatted | When the data has been log processed the Logarithmic Decades determines the number of contours. If the Log option is selected the Contours Per Log Decade value is used. If Unformatted is selected the Number Of Contours is used. |
| Contours Per Log Decade | Integer | If the Log Option is selected for Logarithmic Decades the increments per decade can be set with this value. |
| Number Of Contours | Integer | When the data is log processed the Number Of Contours refers to the number of contours per decade. If the data is linear processed the number of contours refers to the total number of contours to be drawn. |
| Minimum Contour Level | Double | The Minimum contour level displays the minimum value of the Contour Component. |
| User Contour Levels | Double | The Contour Levels are user defined levels. |
| Maximum Contour Level | Double | The Maximum contour level displays the maximum value of the Contour Component. |
| Contour Adjustment | Choice: Band Below, Preserve, Band Above | The Contour Adjustment setting allows contour levels to be shifted slightly up or down to ensure that values exactly on the contour line are included in either the lower or upper data band. |
opacity by nodal data
opacity by nodal data provides a means to adjust the opacity (1 - transparency) of any object based on its data values using a simple ramp function which assigns a starting opacity to values less than or equal to the Level Start and an ending opacity to values greater than or equal to the Level End. The appearance of the resulting output is often similar in appearance to volume rendering. opacity by nodal data converts data into partially transparent surfaces where data values at each point in a grid are represented by a particular color and opacity.
NOTE: Any module connected after opacity by nodal data MUST have Normals Generation set to Vertex (if there is a Normals Generation toggle on the module’s panel, it must be OFF).
Ports
| Direction | Name | Type | Description |
|---|---|---|---|
| Input | Input Field | Field | The field to use for adjusting opacity. |
| Output | Output Field | Field | The field with the new Opacity data. |
| Output | Output Object | Renderable | A renderable object to display. |
Properties
| Property | Type | Description |
|---|---|---|
| Allow Run | Boolean | The Allow Run Toggle will prevent the module from running. This allows the user to make multiple changes without the module constantly updating. |
| Execute | Button | The Run Once button will cause the module to run one time even if the Allow Run toggle has been turned off. |
| Component | Choice | The Component value allows the user to select which data component to use when setting the opacity. |
| Opacity Ramp Start | Double | The Opacity Ramp Start is starting level of opacity to use in creating the output. A value of 0 is considered completely transparent, a value of 100 is completely opaque. |
| Level Start | Double | The Level Start is lower range of the data to begin changing the opacity. Any value below this will be set to the Opacity Ramp Start value. |
| Opacity Ramp End | Double | The Opacity Ramp End is ending level of opacity to use in creating the output. A value of 0.0 is considered completely transparent, a value of 100 is completely opaque. |
| Level End | Double | The Level End is upper range of the data to begin changing the opacity. Any value above this will be set to the Opacity Ramp End value. |
| Non Linear | Boolean | The NonLinear toggle will cause lower values to have lower opacity while higher values will change the opacity more. |
slope and aspect
The slope and aspect module determines the slope and aspect of a surface. The slope is the angle between the surface and the horizon. The aspect is the cardinal direction in degrees (rotating clockwise with 0 degrees being North) that the slope is facing.
Ports
| Direction | Name | Type | Description |
|---|---|---|---|
| Input | Input Field | Field | The field to use for determining slope and aspect. |
| Output | Output Field | Field | The input field with added cell data components representing slope and aspect. |
Properties
| Property | Type | Description |
|---|---|---|
| Z Scale | Double | The Z Scale refers to the vertical exaggeration applied to the input field. This scale will be used to remove all vertical exaggeration prior to calculating gradients. |
| Flat Surface Aspect | Double | The value to use for Aspect Value over a flat surface. |
select single data
The select single data module extracts a single data component from a field. select single data can extract scalar data components or vector components. Scalar components will be output as scalar components and vector components will be output as vector components.
Ports
| Direction | Name | Type | Description |
|---|---|---|---|
| Input | Input Field | Field | The main input field. |
| Output | Output Field | Field | The field with selected data. |
| Output | Output Object | Renderable | A renderable object displaying the selected data. |
Properties
| Property | Type | Description |
|---|---|---|
| Color By | Choice: Node Data, Cell Data, Solid Color | The Color By control allows the user to set how the color of the output should be determined. |
| Nodal Data Component | Choice | If Color By is set to Node Data the Nodal Data Component selects which nodal data will set the data map. |
| Cell Data Component | Choice | If Color By is set to Cell Data the Cell Data Component selects which cell data will set the data map. |
| Copy Flagged Data | Boolean | The Copy Flagged Data toggle allows the user to keep special flagged data (radius, color, etc.) along with the selected data. |
| Object Color | Color | If Color By is set to Solid Color the Object Color will set the data map. |
| Vector Component | Integer | If Color By is set to either Node Data or Cell Data the Vector Component allows the user to use just a single component of a vector data to set the data map. |
| Use Vector Magnitude | Boolean | If Color By is set to either Node Data or Cell Data the Use Vector Magnitude allows the user to use the magnitude of a vector data to set the data map. |
| Vector Naming | String | Vector Naming sets the template for the selected data component name that is created from a vector. |
| Vector Mag Naming | String | Vector Mag Naming sets the template for the selected data component name that is created from a vector’s magnitude. |
import wavefront obj
The import wavefront obj module will only read Wavefront Technologies format .OBJ files which include object textures which are represented (included) as a single image file. Each file set is actually a set of 3 files which must always include the following 3 file types with the same base file name, which must be in the same folder:
- The .obj file (this is the file that we browse for)
- A .mtl (Material Template Library) file
- An image file (e.g. .jpg) which is used for the texture. Note: there must be only ONE image/texture file. We do not support multiple texture files.
This module provides the user with the capability to integrate complex photo-realistic site plans, buildings, and other 3D features into the EVS visualization, to provide a frame of reference for understanding the three dimensional relationships between the site features, and characteristics of geologic, hydrologic, and chemical features.
Info
This module intentionally does not have a Z-Scale port since this class of files are so often not in a user’s model projected coordinate system. Instead we are providing a Transform Settings group that allows for a much more complex set of transformations including scaling, translations and rotations.
Ports
| Direction | Name | Type | Description |
|---|---|---|---|
| Output | Output Object | Renderable | A renderable object displaying the Wavefront OBJ data. |
Properties
| Property | Type | Description |
|---|---|---|
| Allow Run | Boolean | This toggle will prevent the module from running when turned to the Off position. |
| Filename | String | The file containing the wavefront OBJ. |
| Execute | Button | This button will allow the module to run one time even if the Allow Run toggle is turned to the off position. |
Texture Options
| Property | Type | Description |
|---|---|---|
| Image Quality | Choice: Maximum (Up to 8192 X 8192), Very High (Up to 4096 X 4096), High (Up to 2048 X 2048), Medium (Up to 1024 X 1024), Low (Up to 512 X 512), Very Low (Up to 256 X 256), Custom | The Image Quality allows the user to select the maximum resolution to read the input image in at. This allows the user to create a coarse image for faster testing and a high resolution image for the final output. |
| Read Alpha Channel | Boolean | This toggle will prevent the module from reading the image alpha channel into memory when turned to the Off position. |
| Brightness | Integer | The Brightness of the image can be adjusted when the Adjust Brightness toggle is selected. |
| Contrast | Integer | The Contrast of the image can be adjusted when the Adjust Contrast toggle is selected. |
Transform Settings
| Property | Type | Description |
|---|---|---|
| Transform List | Multi-select | The list of transformations applied to the input field. Supports translation, rotation, and scaling operations to place the Wavefront Object in the correct coordinate space. |
Export Settings
| Property | Type | Description |
|---|---|---|
| Export | String | The Filename for the output EVS Textured Field File (*.eft). |