With the kriging interpolation results from 2d estimation, the next step is to refine the visualization. This can be accomplished by subsetting the output to display only the regions that fall within a specific value range.
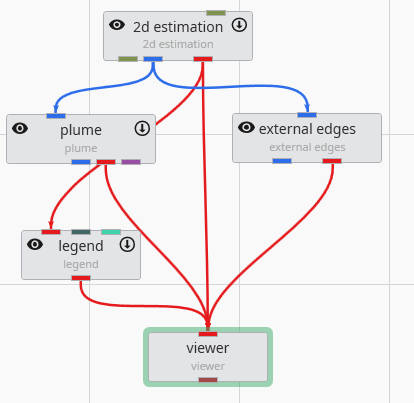
To begin, connect the 2d estimation module to a plume module, and then connect the plume module to the viewer. This directs the data flow through the plume module, which will perform the subsetting operation before rendering the final output.
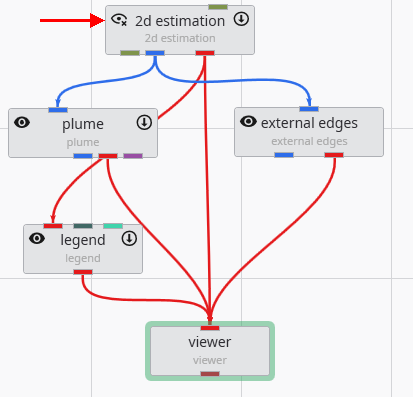
Initially, the viewer’s output may appear unchanged. This is because the 2d estimation and plume modules are rendering overlapping geometry. To isolate the output from plume, you can toggle the visibility of the 2d estimation module. Click the eye icon on the 2d estimation module in the Application Network to hide its output. This feature is essential for debugging complex applications, allowing you to focus on the output of specific modules.
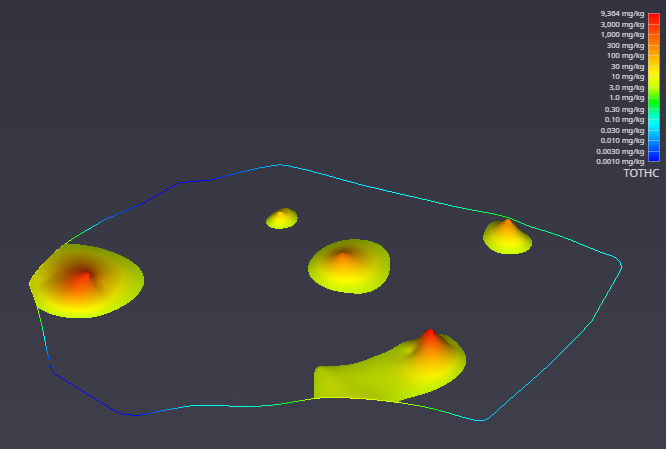
After hiding the upstream module, the viewer updates to show only the geometry from the plume module. The visualization is now more informative, displaying only the areas of interest where the TOTHC value is above 3.06. This default level was automatically determined from the data entering the plume module as a starting point for you to estimate a suitable value in the data range.
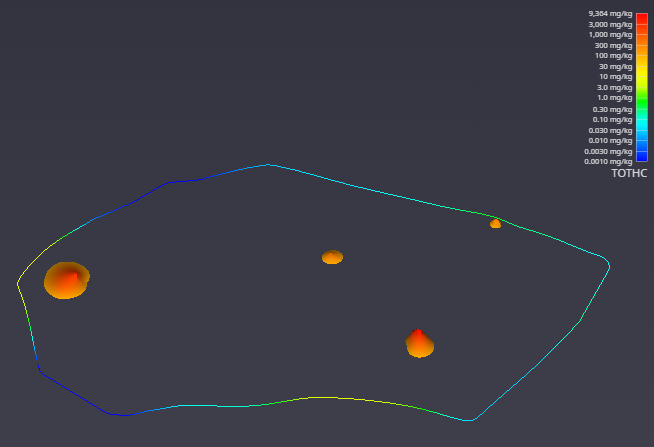
You can easily customize this filtering behavior. To demonstrate, select the plume module by double-clicking it. In the Properties window, set the Subsetting Level to 100.
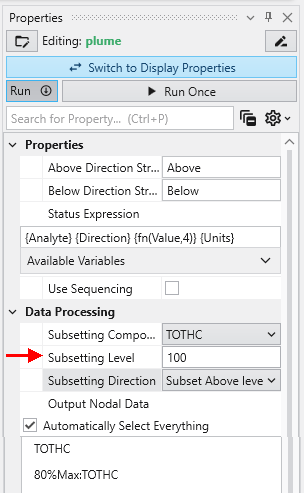
The viewer immediately reflects these changes. As a result, it now renders only the regions with a TOTHC value above 100, effectively further reducing the areas of high concentration. This feature allows you to interactively explore your data and isolate different phenomena within the dataset.