Min-Max Estimate
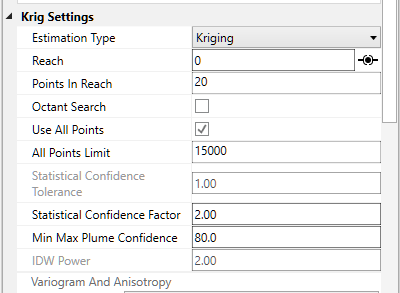
Both krig_2d and 3d estimation include the ability to compute the Minimum and Maximum Estimate, which is computed using the nominal estimates and standard deviations at every grid node based upon the user input Min-Max Plume Confidence.
The issue with our MIN or MAX plumes is that they represent the statistical Min or Max at every point in the grid. It is quite unrealistic to believe that you could possibly have a case where you'd find the actual concentration would trend towards either the Min or Max at all locations.
C Tech's Fast Geostatistical Realizations© (FGR©) creates more plausible cases (realizations) which allow the Nominal concentrations to deviate from the peak of the bell curve (equal probability of being an under-prediction as an over-prediction) by the same user defined Confidence. However, FGR© allows the deviations to be both positive (max) and negative (min), and to fluctuate in a more realistic randomized manner.

For the case of Max Plume and 80% confidence, at each node, a maximum value is determined such that 80% of the time, the actual values will fall below the maximum value (for that nominal concentration and standard deviation). This process is shown below pictorially for the case of a nominal value of 10 ppm with a standard deviation of 1.1 (log units). For this case, the maximum value at that node would be ~84 ppm. This process is repeated for every node (tens or hundreds of thousands) in the model.
Note that for this plot, the entire left portion of the bell curve is shaded. If we were assessing the minimum value, it would be the right side. Statistically, we are asking a different type of question than when we calculate confidence for our nominal concentrations.

If this Confidence value were set to ~81% then we would be adding one standard deviation to the nominal estimate to create the Max and subtracting one standard deviation to create the Min. The higher you set the Min-Max Plume Confidence the greater the multiplier for standard deviations which are added/subtracted to create the Max/Min.
Even though Min & Max Estimates may not be realistic "realizations" of a likely site state, they still provide the best technique to determine when your site is adequately characterized. Some sites may have very complex contaminant distributions and high gradients while others may be very simple. Applying a single standard for sampling based on fixed spacing will never be optimal.
It is up to the regulators and property owners to determine the ultimate criteria, but generally having the ability to assess the variation in the expected plume volume and the corresponding variation in analyte mass within, provides the best metric for assessing when a site has been sufficiently characterized.