Confidence
The Confidence values are the answer to a question, and the wording of the question depends on whether you are Log Processing your data or not.
- For the "Log Processing" case the question is: What is the "Confidence" that the predicted value will fall within a factor of "Statistical Confidence Factor" of the actual value?
- For the "Linear Processing" case, the question is: What is the "Confidence" that the predicted value will fall within a +/- tolerance "Statistical Confidence Tolerance" of the actual value?

So if your "Statistical Confidence Factor" is 2.0 as shown for a Log Processing case above, the question is:
What is the "Confidence" that the predicted value will fall within a factor of 2.0 of the actual value?
The confidence is affected by your variogram and the quality of fit, but also by the range of data values and the local trends in the data where the Confidence estimate is being determined.
If your data spans several orders of magnitude, the confidences will be lower and if your data range is small the confidences will be higher depending also on the settings you use.
If the "Statistical Confidence Factor" were set to 10.0, because we are working on a log10 scale, EVS would take the log10 of the Statistical Confidence Factor (the value was 10, so the log is 1.0). It then compares the log concentration values and a corresponding standard deviation that was calculated for every node in our domain. For log concentrations, one unit is a factor of ten, therefore we are asking what is the probability that we will be within one unit. Above, where the Statistical Confidence Factor is 2.0, the questions would have been: What is the confidence that the predicted concentration will be within a factor of 2 of the actual concentration?
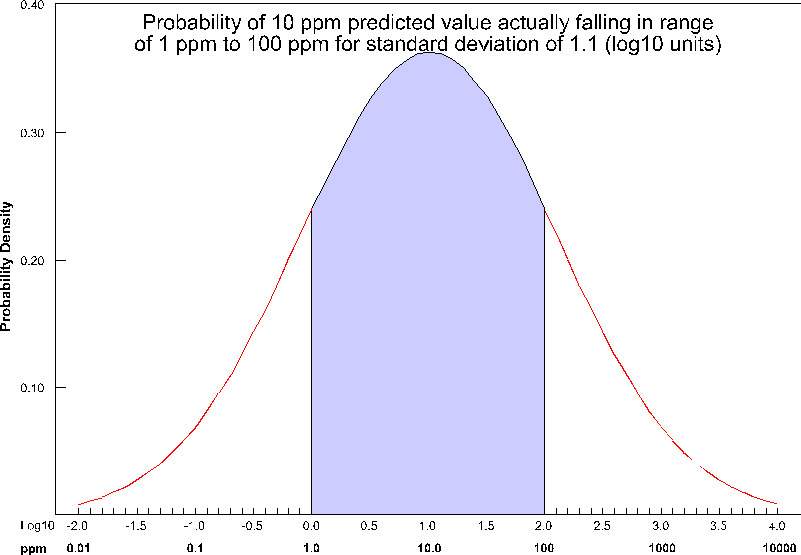
The actual calculation to determine confidence requires the standard deviation of the estimate at a node, and the Statistical Confidence Factor. The figure below shows the confidence (as the shaded area under the "bell" curve) for a Statistical Confidence Factor of 10 at a node where the predicted concentration was 10 ppm (1.0 as a log10 value) and the standard deviation for this point was 1.1 (in log10 units). For this example, the confidence would be ~64%, which means that 64% of the time, the value would lie in the shaded region.


For example, consider the case where we are estimating soil porosity, and the input data values are ranging from 0.12 to 0.29. We would want to use "Linear Processing", and since our values fall within a tight range of numbers we might want to use a "Statistical Confidence Tolerance" that was 0.01. The confidence values we would compute would then be based upon the following question:
What is the "Confidence" that the predicted porosity value will be within 0.01 of the actual value?
If we were careless and used a "Statistical Confidence Tolerance" of 1.0 all of our confidences would be 100% since it would be impossible to predict any value that would be off by 1.0.
However, if we used a "Statistical Confidence Tolerance" of 0.0001, it is likely that our confidence values would drop off very quickly as we move away from the locations where measurements were taken.