Viewing APDV Files
APDV files represent analyte data which is measured at points. The data can be collected at scattered locations or along borings. When boring IDs are included in the file, post_samples will draw the borings as well as the samples.
Create the following application. It is nearly identical to the application used for PGF files, but we do not need to connect the yellow port which contains geology or lithology names, as those are not applicable to APDV (or AIDV) files. However, if you do connect it, it won't hurt anything.

Double click on post_samples to open its Properties window. Select Railyard Facility Complex Python Scripting\railyard.apdv and change the Z Scale to 5 on the Home Tab or Application Properties.

to show the following in the viewer.

post_samples has many options for displaying this type of data (also applicable to PGF, GEO, AIDV). These include (but are not limited to):
- displaying the data as colored tubes (with or without spheres/glyphs)
- using different glyphs to represent each sample (a sphere is the default glyph)
- changing the diameter of glyphs or tubes based on the data magnitudes
- labeling the samples and/or borings
Let's see the four options above:
It is easy to display colored tubes. You can scroll down to the Color Tube Settings or better yet collapse the other settings until you get to it.
Change Display As from None to Tubes.


To change glyphs is incredibly simple. We just go to the Glyph Settings, and we'll change the Generated Glyph to be Cube instead of the default Sphere, and we'll also set the Maximum Scale Factor to be 200%

Since we've still left colored tubes on, our viewer shows:

Before we make any other changes let's set Colored Tubes to "None" which will change our view to be:

Finally, we'll add labels at each sample and the top of the borings:


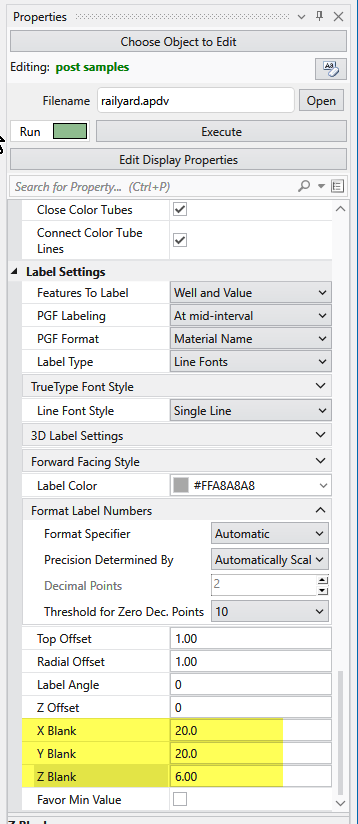
As you can see above, the labels get very dense and it can be hard to see the most important (hottest) samples. post_samples provides functionality to allow you to blank out lower value labels within some distance of hotter samples. Set the X Blank, Y Blank and Z Blank settings to match below and zoom in to see the labels intelligently culled.

Note that the blanking can favor minimum values, such as when you are kriging pH levels.
