Modules, Ports and Data
EVS employs a paradigm where the user builds custom applications using modules which are interconnected between input and output ports. Modules can have a variety of port types which can be identified by their color. Output ports can connect to other module's input ports of similar color.
Modules are grouped into Module Sub Libraries which are discussed here.
The various module ports are summarized in the Module Icons and Port Colors topic. However, among the 10 primary port types, two are the most important and most frequently used. These are Fields and Renderable objects.
Understanding these two port types and the functions incorporated within them is critical to optimizing your productivity with EVS.
FIELD PORTS:  This is the most common port type which is used to pass grids and nodal and/or cell data between modules that create these fields and those that subset or modify them.
-
Grids can have 4 different dimensionalities, but always exist in three dimensions (X, Y & Z):
-
3D (volumes)
-
2D (surfaces)
-
1D (lines)
-
0D (points)
-
-
Grids can consist of sub-grids which are grouped into "cell sets"
-
cell sets are commonly used in EVS to represent:
-
Geologic Layers or Materials
-
CAD Layers
-
-
Individual items in a cell set can contain more than one type of cell.
-
-
Data: Data can be of three types, of which Cell Set Data is behind the scenes.
-
Nodal Data: Is the most common data type in EVS and represents data associated with nodes that define the corners of any cell. Nodal data has a huge advantage over cell data for any grid type that would be subset by analytical data.
-
Cell Data: Is used primarily in EVS to represent geologic information, however it is also used for coloring of annotation data (e.g. shapefiles and CAD)
-
Cell Set Data: is used behind the scenes in EVS for more efficient data storage. Whenever a cell set has cell data which is constant over the cell set, we convert it to cell set data. This may be directly used in a future release of EVS.
-
-
Basic Statistics of grids and nodal data of a field can be accessed by Left-Double-Clicking on the field output port.
RENDERABLE OBJECT PORTS
 : This type of port primarily connects to the viewer and creates an object in the viewer's Table of Contents.

-
Double-Left Clicking on a modules Red port will open a properties window with that modules rendering properties as shown above:
-
Within the rendering properties window there are numerous important features.
-
I will cover only the most important sections and properties here.
-
If a property is not included, you should interpret that as our advise to leave it as is.
-
Important properties will be bold and colored dark blue:
-
Critically important properties will be bold and colored purple:
-
-
General Properties:
-
Visible: This toggle controls visibility
-
Pickable: If off, the object cannot be picked (Ctrl-Left mouse)
-
Opacity Slider: Controls opacity of the object
-
Include All Data in Probe:
-
Faces to Display: Default is "Display All", but "Camera Facing" can be useful when making a closed object transparent.
-
Color By: One of the four most important parameters.
-
This determines how this object will be colored. There are three choices
-
Nodal Data: Uses the Cell Data Datamap
-
Cell Data: Uses the Cell Data Datamap
-
Solid Color: Uses the Object Color
-
-
-
Node Dataselector: One of the most important parameters.
-
Choose the node data desired if Node data is selected in Color By.
-
-
Cell Data selector: One of the most important parameters.
- Choose the cell data desired if Cell data is selected in Color By.
-
Vector Component: If the nodal data is a vector (e.g. velocity), this chooses the component of the vector (0 = x, 1 = y, 2 = z)
-
Use Vector Magnitude:If the nodal data is a vector (e.g. velocity), use the scalar magnitude.
-
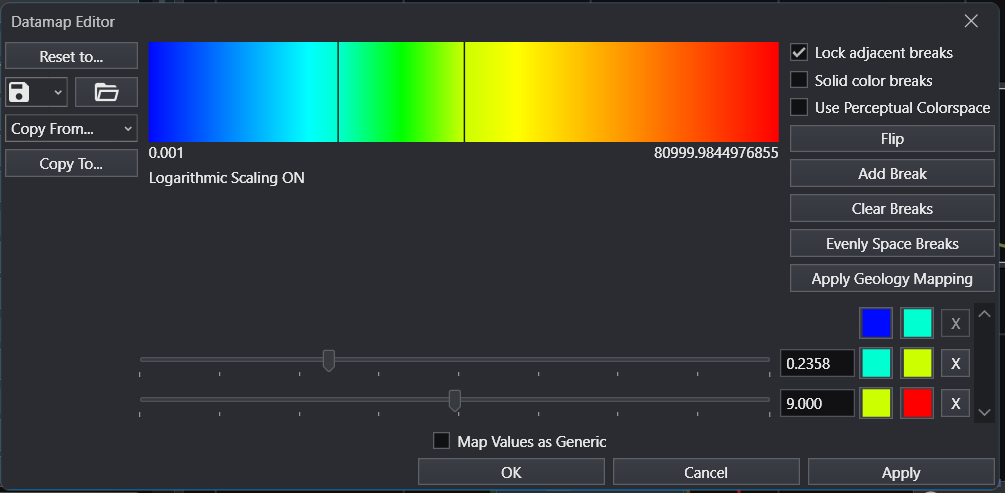
Node Data Datamap: One of the most important Controls.
-
The default datamap is highly recommended, but we make it easy for you to create your own custom colors.
-
Below are are coloring hydrocarbons which were kriged on a Log10 scale and have values ranging from 0.001 to 81,000 (the improper rounding is common with single precision numbers having large magnitudes)
-
Node data supports only numeric data
-
-

-
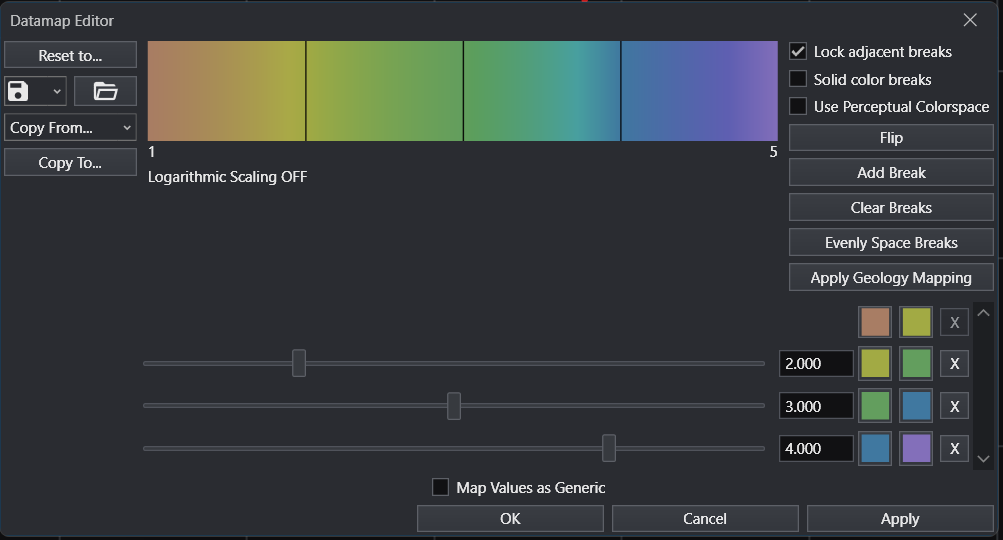
Cell Data Datamap: One of the most important Controls.
-
The default datamap is highly recommended, but we make it easy for you to create your own custom colors.
-
Below is the coloring for 5 stratigraphic layers. Cell data supports only numeric data, but these integers correspond to 5 layer names which are preserved elsewhere.
-
-

-
Object Color:One of the four most important parameters.
-
A color selector allows you to choose the color when Solid Color is selected in "Color By".
-
-
Object Secondary Color:
-
This is the color used if you turn off "Hide Cell Outlines" (below).
-
However, with Hide Cell Outlines off, the Object Color will be used if Surface Display Mode is set to "Hide Surfaces"
-
-
Normal Generation: Changes how edges of surfaces are rendered.
-
Rendering Priority slider:
-
-
Advanced Properties: We strongly recommend leaving all of these properties unchanged unless we advise you differently for a unique issue.
-
Rendering Modes:
-
Hide Cell Outlines:
-
Surface Display Mode: Allows you to change how surfaces are rendered.
-
-
Surface Properties: Change the way light interacts with surfaces and the apparent texture of surfaces. Best to leave alone.
-
Point and Line Properties:
-
Line Style:
-
Solid: Default and most commonly used.
-
Dashed:
-
Dotted: Can be useful to make lines appear more subtle
-
Dashed-Dotted:
-
-
Line Thickness: By default the line thickness is zero which is really a faster rendered version of 1. Higher integers create thicker lines which are often useful.
-