Earth Sciences: Environmental Litigation Support
C Tech’s Earth Volumetric Studio and EnterVol software provide the ability to present reams of complex geologic and environmental contamination data in a form that is easily comprehended by a judge, jury or the public. In our world where 3D models are commonplace on high definition televisions, environmental litigators cannot afford to present complex geochemistry data with graphs and charts. You need defensible, data driven models with the realism to win the jury’s minds and the statistical foundation and sound science to stand up to the most rigorous cross examination.

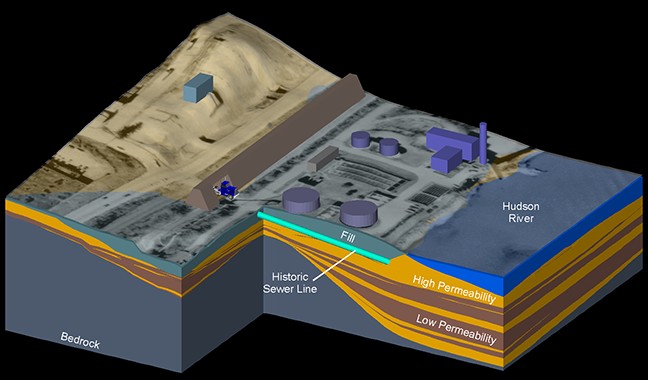
Geostatistical modeling to produce 3-D graphical animations was used to support the expert testimony for the plaintiff (the City of Newburgh, New York, the client) in a case arising from manufactured gas waste contamination. The case was tried in the U.S. District Court in 1999 (City of Newburgh, New York v. Central Hudson Gas & Electric Corporation, 95 Civ. 3863). First Environment Inc. used the Mining Visualization System (MVS) geostatistical software developed by C Tech Development Corp. to visualize the site surface and subsurface conditions at a former manufactured gas plant (MGP) site in Newburgh, New York, adjacent to the Hudson River.
The intended use of the MVS was to illustrate the shoreline history as well as the geology and coal tar contamination at the site. This information was used to explain the migration and accumulation of coal tar contamination related to the former MGP plant. This data was translated into three distinct models that included the historic shoreline and subsurface conditions. Once each model was created, it was used to produce a dynamic computer-driven animation that told a story that could be easily understood by laymen, and which would provide a clear and accurate basis for the expert’s testimony before a jury that ultimately helped the plaintiff’s attorneys assemble a winning case.
C Tech’s Earth Science Software together with our consulting services can provide your team with a multi-faceted strategy to deliver your position with targeted visual communication. Your data can be represented as:
- 3D Models including:
- Aerial Photography
- CAD Models
- Geologic Data
- Contaminant Data
- Animation
- Full Color Physical Models

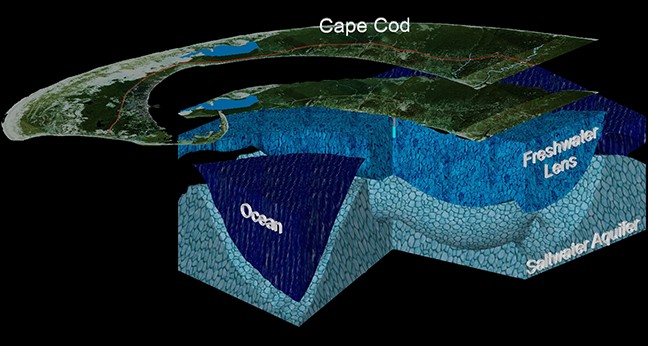
Robin Hughes of McLane Environmental developed this model of Cape Cod’s freshwater lens aquifer system to illustrate to the public and decision makers the effects of ground water pumping on the region’s freshwater aquifer system. Regional lens thinning and localized saltwater upconing of the interface between fresh and salt water beneath well fields is illustrated.

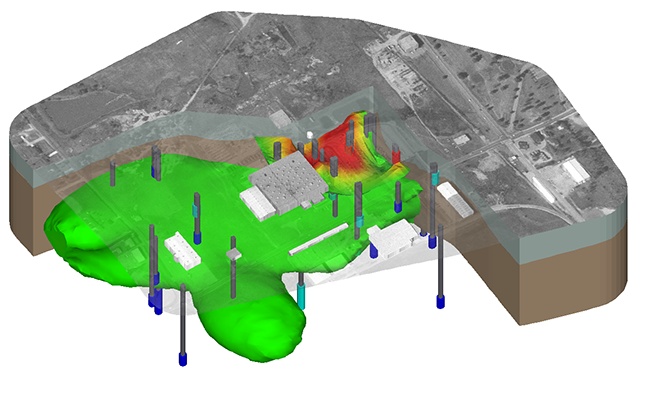
The model above shows Trichloroethylene groundwater contamination at the Vickers site in Missouri includes three-dimensional buildings and an aerial photo. The unsaturated and saturated zones are cut away to reveal TCE displayed with monitoring well screens colored by concentration and plumes at 15, 30 and 50 micrograms per liter. The data was provided courtesy of Patrick Quinn at the Missouri Department of Natural Resources Hazardous Waste Program.

Even with as few as 7 borings and little more than a CAD drawing of the site boundaries and adjacent roads, a compelling model can be produced to convey the extent of contamination at a corner gas station.
For more information on how C Tech can help present your case in the best light, contact:
Reed Copsey, President
C Tech Development Corporation
sales@ctech.com or call (941) 315-5740
