Earth Sciences: Environmental Site Data Visualization
C Tech’s Earth Volumetric Studio provides the ability to perform Environmental Site Data Visualization using dozens of different techniques including:
- Slices, including arrays of slices
- Cuts
- Plumes
- Continuous shading
- Solid colored contours
- 3D Fence Diagrams (cross-sections)
- Intersections of multiple analytes
- Unions of multiple analytes
- Isolines
- Streamlines and Streamtubes displaying vector data
- Volume rendering (volumetric opacity as a function of an analyte)
- Geologic texturing (USCS or FGDC Patterns or photorealistic textures)
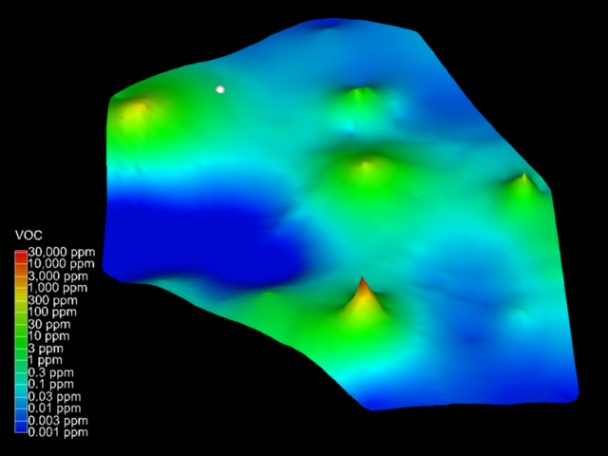
The gray sphere represents the area of highest uncertainty.