Earth Sciences: Geology Modelling
Earth Volumetric Studio and EnterVol are essential tools for geologists and geophysicists.
No longer are you limited to 2D fence diagrams and crude guesses. Discover dozens of new ways to interpret your site’s boring logs as a group in 3D.
Earth Volumetric Studio has the ability to build extremely complex geologic models directly from boring logs using indicator kriging in addition to our stratigraphic geologic modeling based on geologic horizons for modeling sites such as Sedimentary Geology.
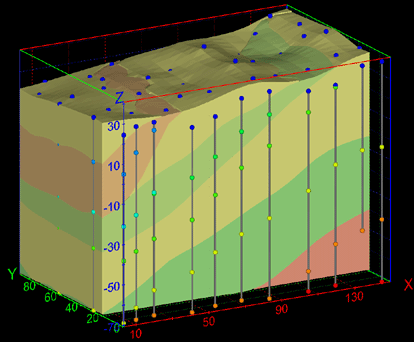
Earth Volumetric Studio can create complex models that accurately represent subsurface lithology as seen in the 3D Interactive Model below:

Studio’s Geology modules quickly transform borehole observations into geologic structures with mass and volume calculation by geologic layer.
CASE STUDY: The following work was performed in 2002, long before the release of Earth Volumetric Studio. For that reason, this report references MVS which was the predecessor of Studio.
3D Modeling of Regolith Processes
3D modeling of stratigraphy and geochemistry is critical to enhancing our understanding of supergene processes. Some of the critical studies are the shape of the supergene halo, mass balance for Au and other elements during weathering, and relationships with regolith stratigraphy, geology, and water table. Such studies could be done in areas with extensive grade control data or in areas with only exploration data. The program MVS (Mining Visualization System) has been found to be extremely useful in understanding and quantifying regolith dispersion processes. Sample applications and results are shown below
Relationships between regolith layers can be observed by gridding the stratigraphy and then viewing the regolith separately or together. Argo is a deeply weathered Au ore body adjacent to a major palaeochannel, south of Kalgoorlie, Western Australia. Due the high quality of regolith logging by WMC Exploration Ltd., 10 separate regolith materials could be viewed. Various attributes include the erosion of various in-situ regolith horizons along the palaeovalley, position of transported gravels and sands along the palaeovalley floor, and location of lignite and spongolite materials.
Regolith stratigraphy of the Argo area, looking north-east
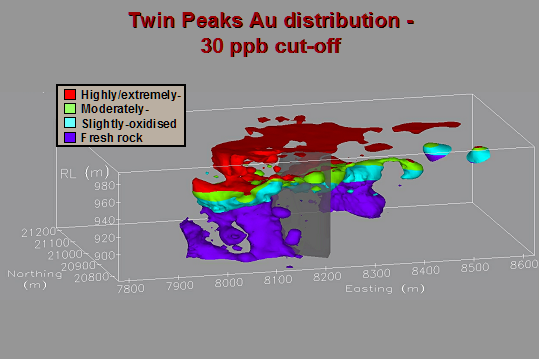
Cut-off (3D Plume) diagrams are a common method for visualization of Au grades. It shows solid fill above a specified cut-off, in this case 30 ppb. Commonly we colour the fill according to stratigraphy. The diagram for Twin Peaks shows the axis of the mineralized vein, the depletion front at the base of the highly oxidised zone, and the surface anomaly extending from the surface expression of the original Au vein. Note that any one diagram gives no information of the magnitude of the concentration within the solid fill. I.e., if the cut-off is 50 ppb, the Au plume could be a mineralized vein at > 1 ppm or a supergene dispersion blanket with maximum 100 ppb Au
MVS’s geostatistics modules were used to estimate gold concentrations using all available assay data. This visualization shows all regions with an Au grade above 30 ppb and the ore body is colored according to stratigraphy. This Twin Peaks visualization shows the axis of the mineralized vein, the depletion front at the base of the highly oxidised zone, and the surface anomaly extending from the surface expression of the original Au vein.
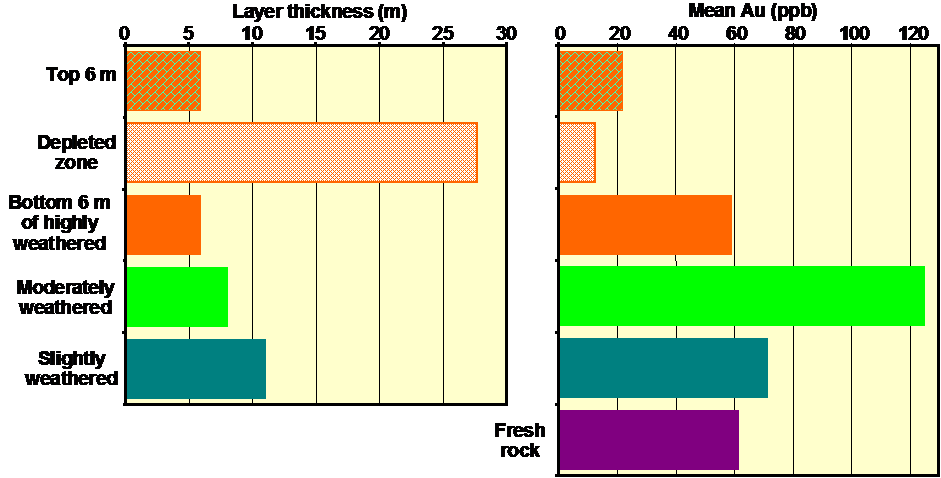
The MVS program enables a variety of Au concentration calculations:
Calculations of thicknesses and Au concentrations of the regolith layers at Twin Peaks indicates the thick (28 m) depletion of Au (12 ppb) in the upper regolith.
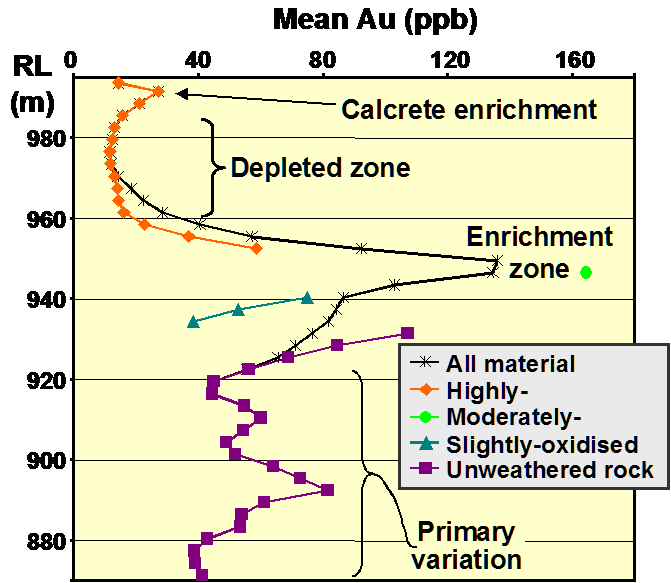
This depletion (as well as the underlying enrichment zone) can also be observed in a concentration vs. RL graph, both for the entire regolith (black stars) and individual layers
These methodologies have been a major enhancement of our ability to investigate supergene processes.
Acknowledgements:
These investigations were conducted as part of CRC LEME / AMIRA Project 504 “Supergene mobilization of gold and other elements in the Yilgarn Craton”. We would like to thank all company sponsors who provided funding for the project, as well as access and logistical support to the project sites and exploration databases and geological information. The Cooperative Research Centre for Landscape Evolution and Mineral Exploration (CRC LEME) is an unincorporated joint venture between The Australian National University, University of Canberra, Australian Geological Survey Organization and CSIRO Exploration and Mining established and supported by the Australian Government’s Cooperative Research Centres Program.
Work performed under The Cooperative Research Centre for Landscape Evolution and Mineral Exploration’s Project 504 “Supergene mobilization of gold and other elements in the Yilgarn Craton”. Dr David J. Gray of CSIRO Exploration & Mining in Wembley, Western Australia used MVS as the primary tool to perform 3D modeling of stratigraphy and geochemistry in their research to enhance understanding of supergene processes. Some of the critical studies are the shape of supergene halo, mass balance for Au and other elements during weathering, and relationships with regolith stratigraphy, geology, and water table.


