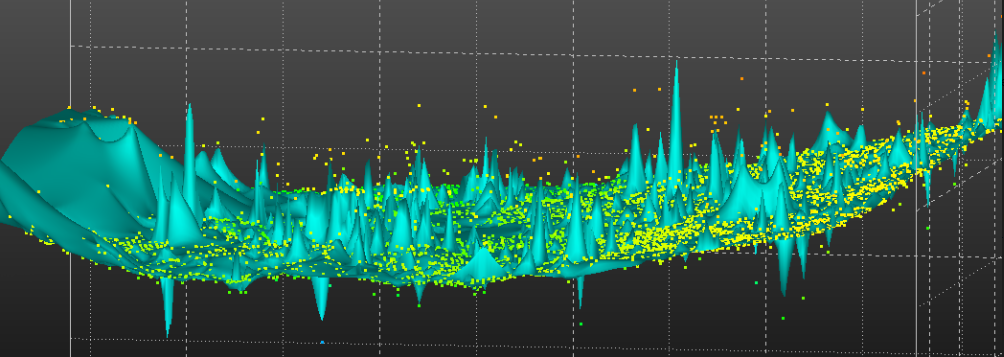
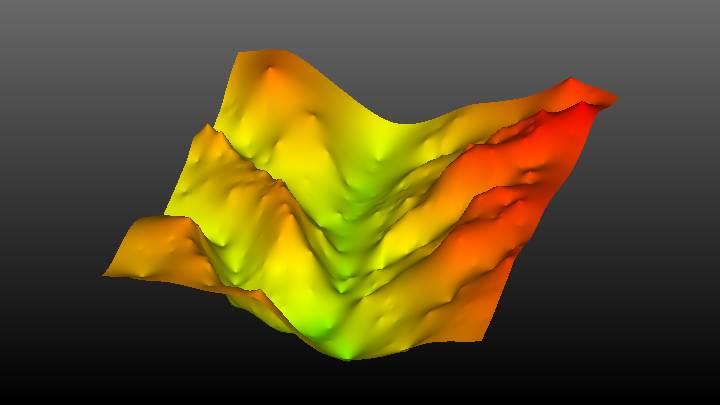
If I have surfaces that look like this with lots of peaks and troughs, is there an easy way to create a smooth surface, even if it doesn’t necessarily try to “honor” every point, more like a least squares fit?
Generally, everyone at C Tech is accustomed to saying that we always honor your data. We have one module that specifically doesn’t do that, which is polyline_spline, but it is designed to work only with lines. With everything else, certainly the default settings will strive to honor your data.
The simplest way to NOT honor your data is to use a coarser grid, but even that can still pick up one of the spike values shown above and result in an unacceptable result.
For much more than 20 of our 29 years there was no solution to this problem…..but, before you walk away unhappy, it is very possible now.
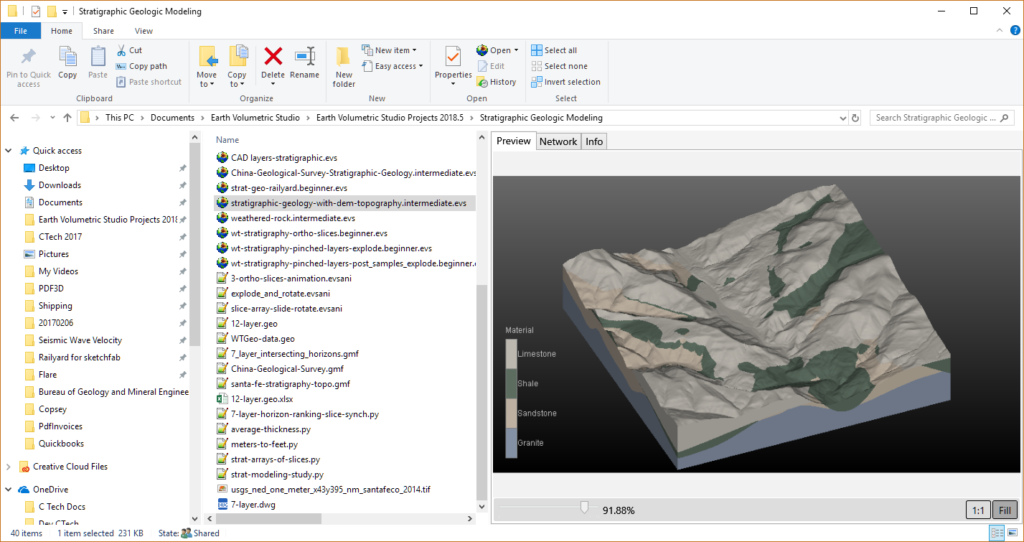
To show you how (and since I don’t have the customer’s dataset above), we’ll start by opening one of our Sample Projects shown below:
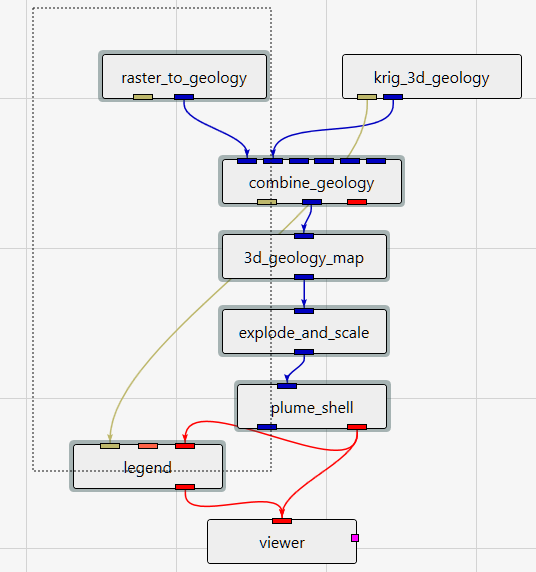
As soon as you open it, select these 6 modules and delete them. This leaves us with the 4 stratigraphic surfaces defined by a relatively high-resolution GMF file.
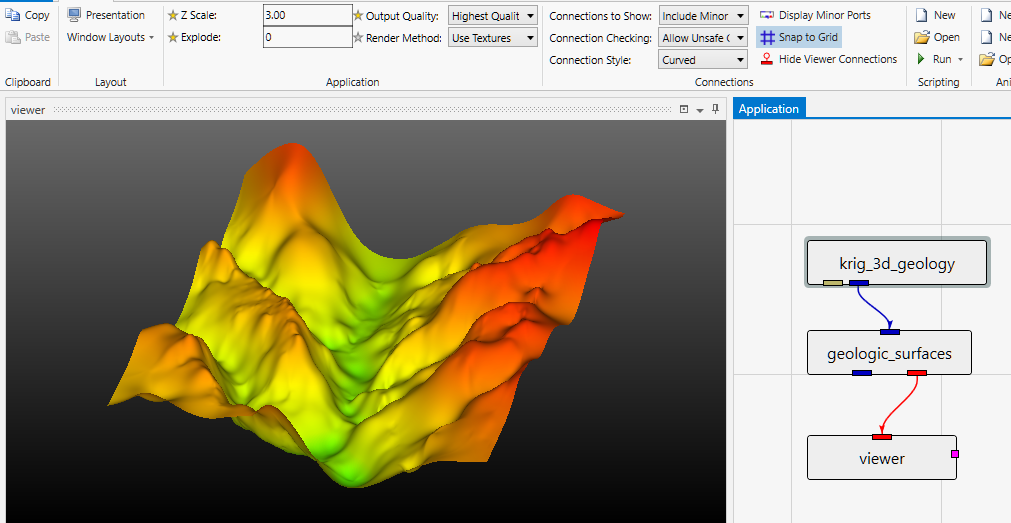
If we add a geologic_surfaces module we can see the first of the stratigraphic surfaces. The selected Estimation Method for this application is Natural Neighbors with the Gradients option on. This tends to give us the smoothest surfaces that still honor our data.
Proof of that is that if we switch to kriging (but with all default values) the result is shown below. It is similar, but to my eye, definitely not smoother!
Kriging tends to give us spiky points and divots at the samples.
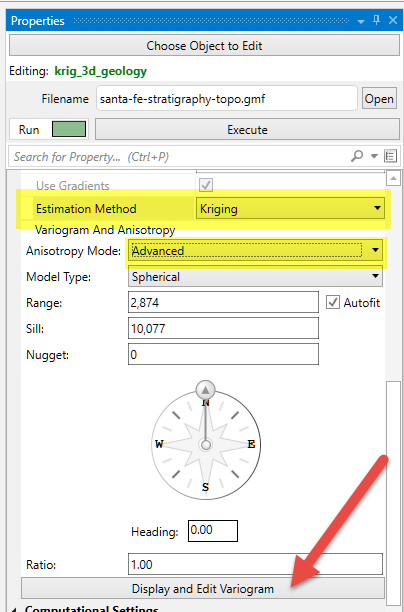
To achieve smoothing we need to take advantage of some of the advanced options, most specifically the Nugget term. Choose the settings below and click on “Display and Edit Variogram”
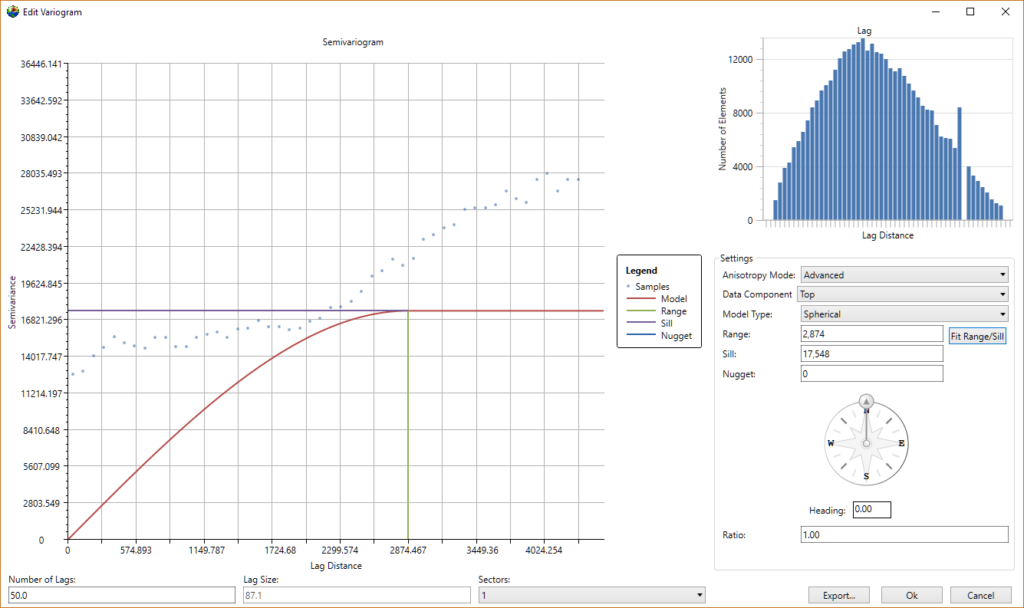
When you do that, the window below will open. You may be surprised by the apparent “poor” fit of the expert system’s best fit variogram. However, you need to remember that it is a constrained best-fit and those constraints are rather complex (and not published). You can always adjust these, but if/when you do, we would advise you to follow these guidelines:
- Feel more free to depart from expert-system variograms when dealing with surface data
- Let the end result be your guide far more than the goodness-of-variogram-fit
- Be more cautious when dealing with environmental data unless you have a strong geostatistics background
- Let common sense be your guide far more than the goodness-of-variogram-fit
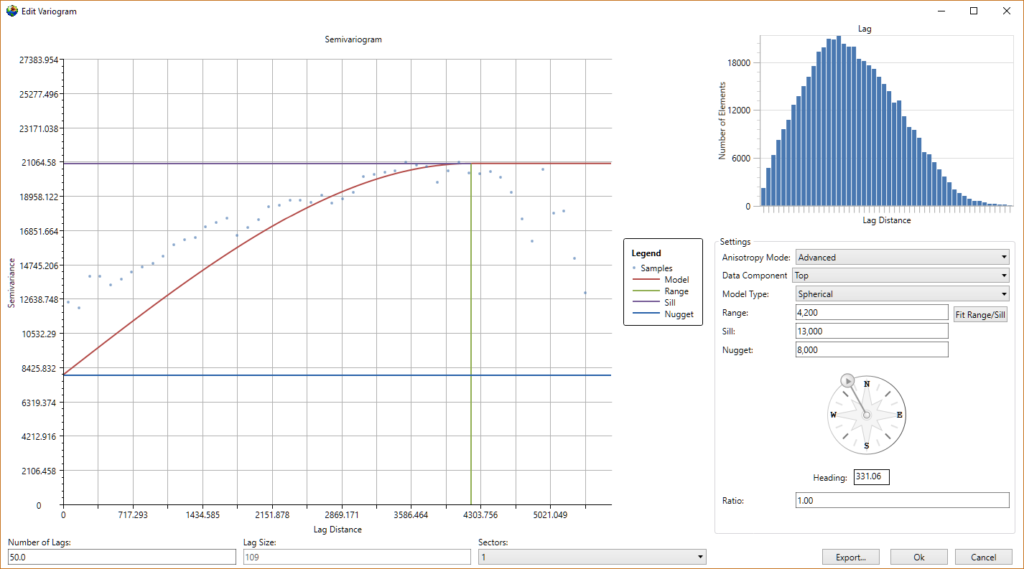
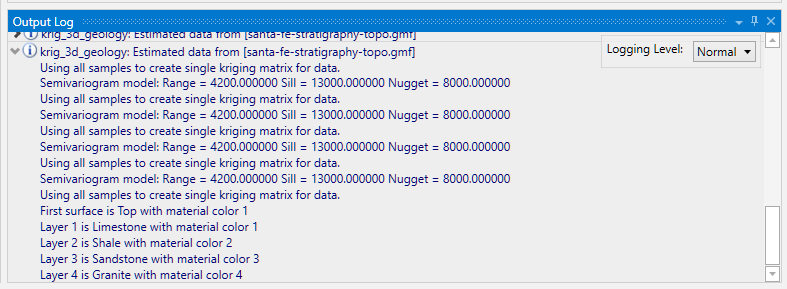
We’ve seen what the above default settings give us. After several iterations (including some bizarre results with Gaussian Model Types), I settled on the values shown below. You need to remember that the magnitudes of the Sill and Nugget terms are not in your data units (feet or meters for a stratigraphic surface) but rather are variances (differences squared). This means that my selected nugget term of 8,000 is allowing the surface to depart from the data by “as much as” the square-root of 8,000, which is about 90 units. It isn’t forcing it to be in error of the data by 90, just allowing it to deviate if that fits a lower-energy surface.
I also strongly advise you to confirm (in the Output Log) that you’ve actually used the variogram settings you specify in the Edit Variogram window. For whatever reason, sometimes the settings don’t get properly applied.
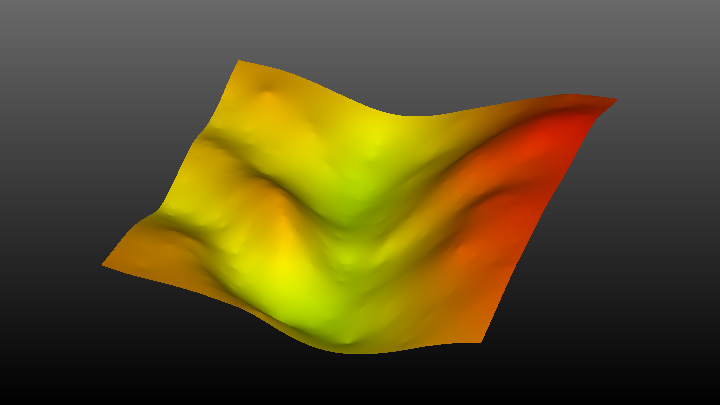
But when they do, we are able to get a dramatically smoother surface!

